
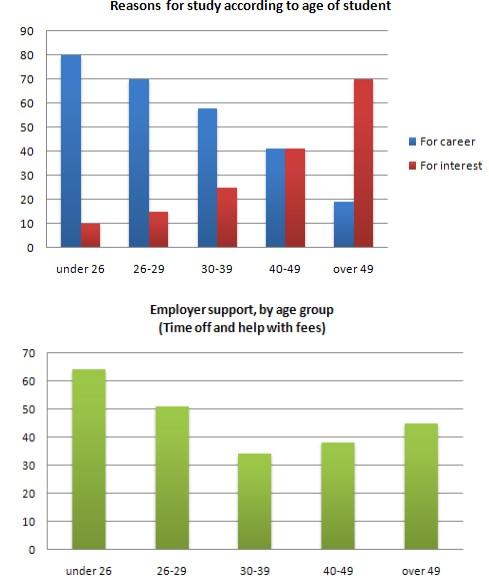
The bar charts depict the principal reasons for studying among people of different age categories and the support they are receiving from the employees.
Overall
, we can see that the younger group are studying for a career, and the older bracket studies more because they are interested in that. Linking Words
In addition
, employer help is more important for younger people and starts decreasing in the middle.
Linking Words
Firstly
, those who are under 26 study for a working purpose around 80%, Linking Words
while
only like 10% study for interest. Linking Words
Similarly
, in the cohort of 26 to 29, it is still the most common reason, but the percentage is lower than before. Linking Words
However
, when age increases, the number of people who study for a career decreases. Linking Words
For example
, the group of 40 to 49 is equal.
Linking Words
Finally
, for some over 49, interest starts becoming the main reason, with more than 70% , and career goes to 20%. Linking Words
Secondly
, the employer support is higher for younger generations, with 65%. After, it falls to lower than 40% for those who are 30 to 39.Linking Words