
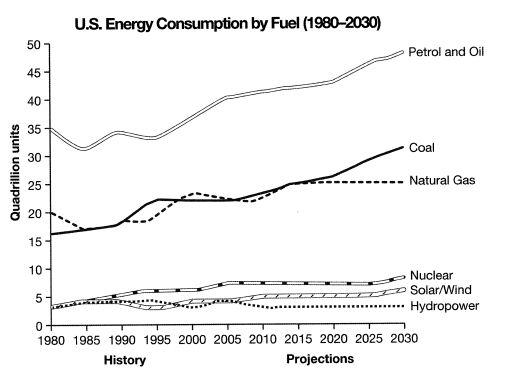
This
line graph reflects the different types of Linking Words
energy
consumed in the United States from 1980 to 2018 and projects their future Use synonyms
consumption
through 2030.
From 1980 to 1995, petrol and oil Use synonyms
consumption
fluctuated between 30 and 35 Use synonyms
billion
Use synonyms
tonnes
, growing faster after 1995 to over 40 Use synonyms
billion
Use synonyms
tonnes
. By 2030, it's projected to reach nearly 50 Use synonyms
billion
Use synonyms
tonnes
.
Coal use grew steadily from 1980 to 1990, Use synonyms
then
rapidly to 22 Linking Words
billion
Use synonyms
tonnes
in 1995. It remained constant until 2005 and is projected to grow rapidly after 2018. Natural gas use was volatile between 15 and 20 Use synonyms
billion
Use synonyms
tonnes
from 1980 to 1995, peaking at nearly 25 Use synonyms
billion
Use synonyms
tonnes
after 1995. It's since ebbed and flowed without exceeding 25 Use synonyms
billion
Use synonyms
tonnes
and is predicted to remain stable.
Renewable Use synonyms
energy
Use synonyms
consumption
(nuclear, solar, wind, hydropower) has been modest, never exceeding 10 Use synonyms
billion
Use synonyms
tonnes
. Nuclear Use synonyms
energy
is the most used and follows a slow-growth trend, Use synonyms
while
hydroelectricity Linking Words
consumption
has never exceeded 5 Use synonyms
billion
Use synonyms
tonnes
and shows a slow downward trend.
Use synonyms
Overall
, non-renewable Linking Words
energy
sources are consumed much more than renewable Use synonyms
energy
sources. Of these, oil and petrol are used much more than other Use synonyms
energy
sources.Use synonyms