
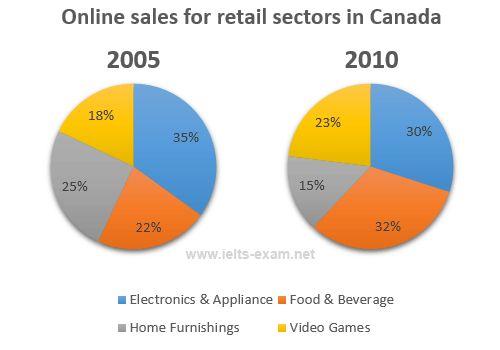
The following pie charts illustrate the cyberspace purchasing for commerce sectors in Canada in the 5-year period of time from 2005 and 2010.
Looking from an
overall
perspective, it is readily apparent that the retail sectors to increase were video games and food and beverage, Linking Words
on the other hand
, electronics, appliance, and home furnishings decreased over the given period.
Linking Words
According to
the figure, video games accounted for just under a fifth to go up by 5 per Linking Words
cent
in 2010. Use synonyms
Likewise
, food and beverage comprised 22 per Linking Words
cent
at first to climb considerably by exactly 10 per Use synonyms
cent
in the end.
As for remaining, electronics and appliances made up just over a third which Use synonyms
then
fell by a mere 5 per Linking Words
cent
in the Use synonyms
last
year of the graph. Linking Words
Lastly
, home furnishings took up precisely a quarter in the beginning, and went down significantly by a tenth in the final year surveyed.Linking Words