
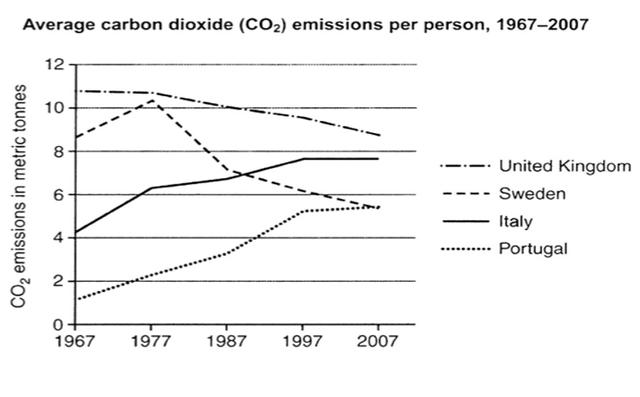
The line graph given illustrates average
carbon
Use synonyms
dioxide
emissions per person in various Europe nations over a forty-year period from 1967 to 2007.
From an Use synonyms
overall
perspective, it is evident that Linking Words
amount
of Correct article usage
the amount
carbon
Use synonyms
dioxide
fumes Use synonyms
on
each Change preposition
from
citizens
in the United Kingdom showed Change to a singular noun
citizen
an
downward trend, Change the article
a
whereas
a reverse pattern can be Linking Words
been
in the data on Italy and Portual over the years shown.
From the beginning of the period, the weight of Correct your spelling
seen
carbon
Use synonyms
dioxide
compound counted Use synonyms
on
Change preposition
by
person
in the UK was Add an article
the person
a person
highest
, at approximately 11 metric Correct article usage
the highest
tonnes
. The figures for Sweden and Italy were lower, at nearly 9 metric Use synonyms
tonnes
and just over 4 metric Use synonyms
tonnes
. Portugal, Use synonyms
however
, accounted for the lowest number, at approximately 1 metric ton.
In the following years, after Linking Words
reached
a peak of over 10 metric Change the form of the verb
reaching
tonnes
in 1977, the number of Use synonyms
carbon
Use synonyms
dioxide
Use synonyms
realesed
in Sweden underwent a significant fall to under 6 metric Correct your spelling
released
tonnes
in 2007, Use synonyms
meanwhile
the data on the UK steadily fell to about 9 metric Add a comma
meanwhile,
tonnes
in the final year. The figure for Italy gradually increased to nearly 8 metric Use synonyms
tonnes
Use synonyms
in
the end of the period, Change the preposition
at
whereas
that of Portugal Linking Words
considerable
rose from over 6 metric Change the word
considerably
tonnes
to nearly 8 metric Use synonyms
tonnes
between 1997 and 2007.Use synonyms