The table and charts below give informations on the police budget for 2017 and 2018 in one area of Britain. The table shows where the money came from and the charts show how it was distributed. Summarize the information by selecting and reporting the main features, and make comparison where relevant

The table and charts below give informations on the police budget for 2017 and 2018 in one area of Britain. The table shows where the money came from and the charts show how it was distributed. Summarize the information by selecting and reporting the main features, and make comparison where relevant
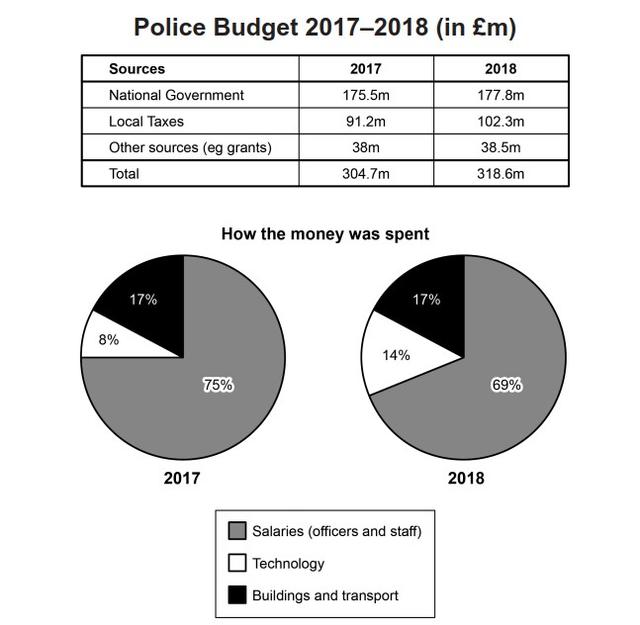
The table compares and contrasts the data of police department sources of income in millions of euros,
while
the pie charts depict percentages of how the budget was spent between 2017 and 2018 somewhere in Britain. In general, the highest earnings were in 2018 from the national government, and both in 2017 and 2018 the salaries for officers and staff were the principal outcomes. It can be seen from the table that in just over one year, the total budget increased by around ten million euros. Interestingly, local taxes had a major growth of about ten million euros,
while
the national government and other sources had just a slightly positive trend. Moving on to the pie charts, in 2018, the expense of technology nearly doubled from 2017 from 8% to 14%. For that reason, salary payments decreased by about 6% from 75%.
This
contrasts with buildings and transport costs that stagnated by 17% over time
Submitted by karinara.projects on

Unauthorized use and/or duplication of this material without express and written permission from this site’s author and/or owner is strictly prohibited. Excerpts and links may be used, provided that full and clear credit is given to Writing9 with appropriate and specific direction to the original content.

Linking words: Don't use the same linking words: "while".
Vocabulary: The word "charts" was used 2 times.
Vocabulary: The word "table" was used 2 times.
Vocabulary: The word "about" was used 2 times.
Vocabulary: Use several vocabularies to present the data in the second paragraph.
What to do next:
Look at other essays: