
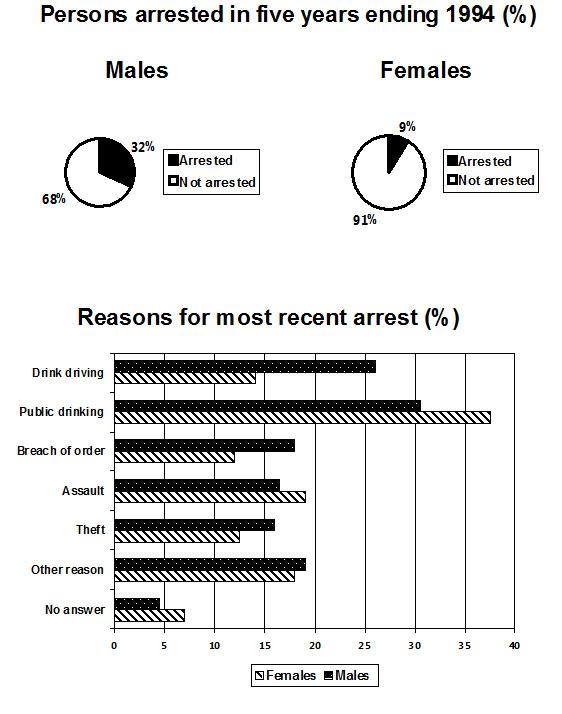
The pie chart illustrates the percentage of people that were arrested in the five years ending 1994,
while
the bars show the statistics for the latest cases of arrest. Generally, the pie chart shows that the majority of people who were arrested Linking Words
was
mostly men than Change the verb form
were
women
. Use synonyms
Then
, the bars show that public drinking had the biggest number as a reason for most latest arrests.
It can be seen that the pie chart gives information if males led the first place for the percentage of citizens that get arrested, which was around 32 per Linking Words
cent
, Use synonyms
while
the females only had 9 per Linking Words
cent
. Use synonyms
Then
, the number of citizens that are not arrested mostly comes from Linking Words
women
which was around 91 per Use synonyms
cent
.
Use synonyms
Furthermore
, the bars show that the statistics of public drinking came from Linking Words
women
rather than men, that they were able to hit less than 40 per Use synonyms
cent
and more than 30 per Use synonyms
cent
, respectively. Use synonyms
However
the next case was doing the total opposite, since the second place for Linking Words
this
term was led by drunk driving, Linking Words
this
case mostly came from males around more than 25 per Linking Words
cent
. Use synonyms
While
the Linking Words
women
citizens only had less than 15 per Use synonyms
cent
.Use synonyms