
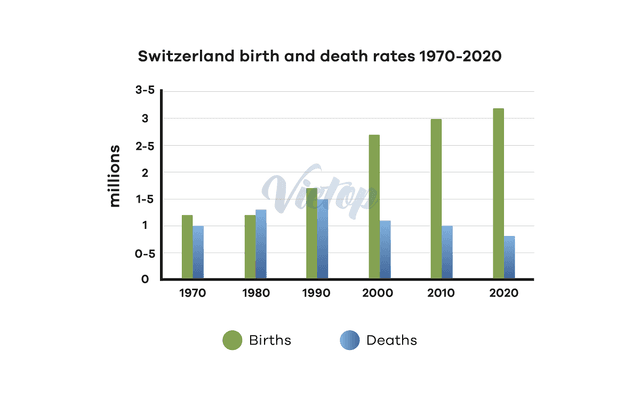
The given bar graph illustrates data about birth and death shares between 1975 and 2025 in Switzerland as stated by United Nations statistics. The units were measured in millions every decade.
Overall
, it can be clearly seen that the number of babies born increased gradually, Linking Words
whereas
the death Linking Words
rate
grew slightly before decreasing until the end of the period.
As the bar graph shows, the figure for the birth Use synonyms
rate
stood at 1.3 Use synonyms
million
in 1975 and was unchanged in 1985, in Use synonyms
this
year the number of deaths was higher than the birth Linking Words
rate
. Afterwards, the Use synonyms
rate
experienced a gradual rise starting in 1995 and reached its highest point in the Use synonyms
last
year at 3.2 Linking Words
million
.
Regarding the death Use synonyms
rate
, in 1975 the number began at 1 Use synonyms
million
and reached a peak in 1995 at 1.5 Use synonyms
million
. Use synonyms
Subsequently
, starting in 2005 the Linking Words
rate
dropped slightly until 0.8 Use synonyms
million
in 2025, the lowest point throughout the given period.Use synonyms