
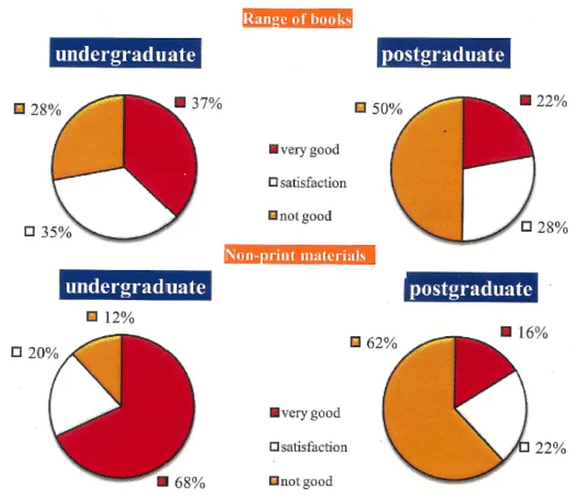
The pie charts illustrate the outcome of a survey relating to the rating of the
range
of Use synonyms
books
and non-printed Use synonyms
materials
from undergraduate and postgraduate Use synonyms
students
in their library.
Use synonyms
Overall
, it could be seen that Linking Words
students
in that school voted for both documents to a very good level. Use synonyms
However
, it was true that the rating tendency of Linking Words
postgraduates
about the Use synonyms
range
of Use synonyms
books
and non-printed Use synonyms
materials
was not good.
Looking at the charts’ Use synonyms
range
of Use synonyms
books
, there were 37% of undergraduates considered the Use synonyms
range
of Use synonyms
books
not good, Use synonyms
while
Linking Words
this
percentage of postgraduate Linking Words
students
just contributed 22%. Use synonyms
Moreover
, the ratio of Linking Words
postgraduates
feeling not satisfied with the Use synonyms
range
of Use synonyms
books
was half. Use synonyms
In addition
, the feeling of satisfaction in undergraduates and Linking Words
postgraduates
contributed 25% and 28%, respectively.
Turning to the rest, a similar trend could be seen in the feedback about non-printed Use synonyms
materials
from two types of Use synonyms
students
. Use synonyms
While
62% of Linking Words
postgraduates
showed dissatisfaction with these Use synonyms
materials
, the portion of Use synonyms
students
voting very good for non-printed Use synonyms
materials
was 68%. Use synonyms
Nevertheless
, the ratios of satisfaction rating of both were quite low, around a quarter.Linking Words