
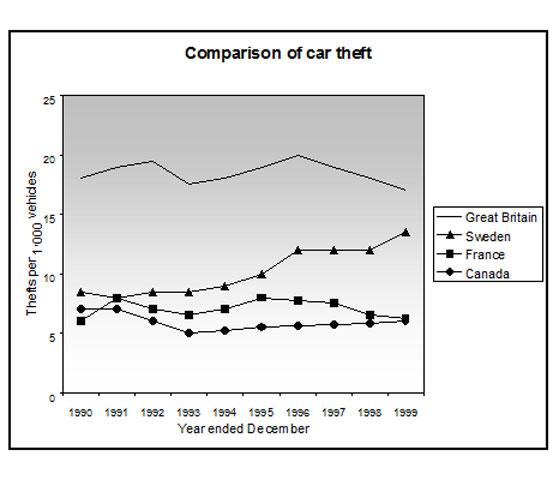
The given line chart illustrates how much automobile was stolen in four different
countries
from 1990 to 1999. Units are measured in thievery per thousand vehicles.
Use synonyms
Overall
, it can clearly be seen that all of the Linking Words
countries
started at approximately the same amount of Use synonyms
number
, with the exception of Great Use synonyms
Britain
. Use synonyms
Moreover
, Great Linking Words
Britain
had the highest figure of thefts over the year.
In terms of the two Use synonyms
countries
with the highest Use synonyms
rate
of thefts, the Use synonyms
figure
for Great Fix the agreement mistake
figures
Britain
and Sweden stood at around 18 and about 9, respectively. The Use synonyms
rate
Use synonyms
of
Great Change preposition
in
Britain
Use synonyms
then
rose gradually to exactly 20 between 1990 and 1993. Linking Words
Subsequently
, it fluctuated noticeably before undergoing a steady drop and hitting the trough by the same Linking Words
number
as the starting point in the final year. Use synonyms
In contrast
, the Linking Words
number
of Sweden increased drastically with small fluctuations and peaked at almost 15, just under Great Use synonyms
Britain
, in the same period.
Regarding the other two Use synonyms
countries
with the lower Use synonyms
number
of thefts, the figure for France and Canada started at just above 5 and around 8, successively. The Use synonyms
rate
of France Use synonyms
then
fluctuated very slightly between 5 and 8 in the following nine years. Linking Words
Likewise
, the Linking Words
rate
of Canada experienced quite the same movement. Use synonyms
As a result
, both end up on the same level.Linking Words