
There are two
pie
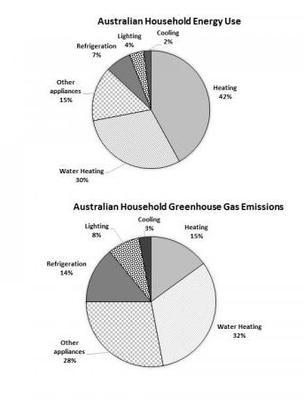
charts provided. The first Use synonyms
pie
chart provides details about the Use synonyms
energy
usage needed by most Australian households, and the second Use synonyms
pie
chart illustrates the Use synonyms
greenhouse
Use synonyms
gas
Use synonyms
emissions
produced from the Use synonyms
energy
usage. Use synonyms
Overall
, heating is one sector that needs the most Linking Words
energy
, Use synonyms
while
Linking Words
water
heating is the sector that makes the most Use synonyms
greenhouse
Use synonyms
gas
Use synonyms
emissions
.
In decreasing order, the six main Use synonyms
energy
usages are heating, Use synonyms
water
heating, other appliances, refrigeration, lighting, and cooling. Use synonyms
Furthermore
, the two largest of these are heating and Linking Words
water
heating, which are about 42% and 30%, respectively. The other sectors are all worth significantly less, with other appliances at around 15% and the other three, refrigeration, lighting, and cooling are contributing less than 10%.
Use synonyms
On the other hand
, Linking Words
the
Correct article usage
apply
greenhouse
Use synonyms
gas
Use synonyms
emissions
are mainly produced from the Use synonyms
water
heating sector, which accounts for around 32%. Use synonyms
Then
, the next largest Linking Words
emissions
come from other appliances, heating, and refrigeration at 28%, 15%, and 14% respectively. Use synonyms
Overall
, it can be seen from the second Linking Words
pie
chart, that the sectors which produce the least Use synonyms
greenhouse
Use synonyms
gas
Use synonyms
emissions
are lighting and cooling which are all below 10%.Use synonyms