
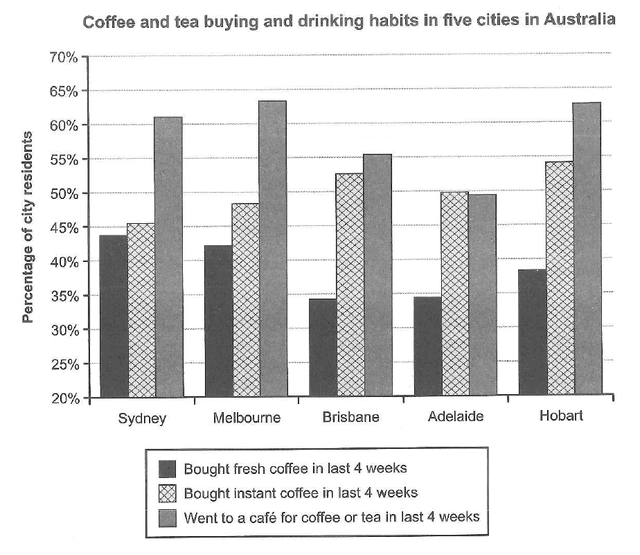
The bar graph illustrates five distinct Australian
residents
' percentage of habitual activities of buying and drinking Use synonyms
coffee
and tea. Use synonyms
Overall
, it can be vividly seen that in the Linking Words
last
4 weeks, city dwellers have relished drinking Linking Words
coffee
at a cafe, except citizens in Adelaide who are very likely to buy instant Use synonyms
coffee
. Use synonyms
On the other hand
, enjoying fresh Linking Words
coffee
became the Use synonyms
last
favourable way for all the Linking Words
residents
.
Looking at the data in a more detailed analysis, all Australians admire going to a cafe to enjoy their drink. Melbourne and Hobart Use synonyms
residents
accounted for around 63%, which makes them the highest percentage. Use synonyms
However
, in Adelaide, they become the Linking Words
last
position for activity (below a half). Turning to the figure Linking Words
for instance
Linking Words
coffee
, every city makes a similar percentage around 45% in Sydney to almost 55% in Hobart.
For the remaining category, which is drinking fresh Use synonyms
coffee
, Brisbane and Adelaide have the lowest proportion of citizens who like to do Use synonyms
this
activity. They both have only 34% of the total citizens. Linking Words
Following
Linking Words
this
one, there are approximately 38% of Hobart Linking Words
residents
who like to do the same.Use synonyms