The line graph below shows the household recyclling rates in three different countries between 2005 and 2015. Summarize the information by selecting and reporting the main features, and make comparisons where relevant.

The line graph below shows the household recyclling rates in three different countries between 2005 and 2015.

Summarize the information by selecting and reporting the main features, and make comparisons where relevant.
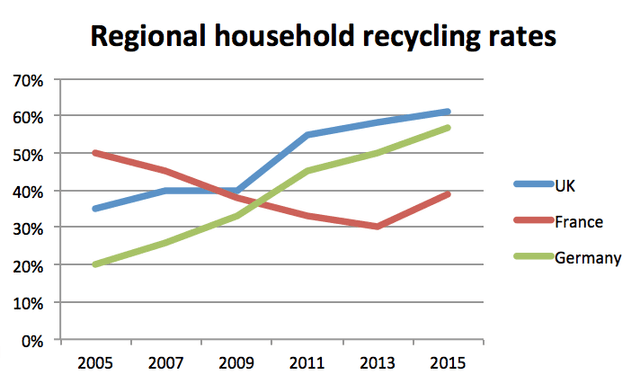
The below line graph demonstrates the regional household recycling rates in the UK, France and Germany between 2005 and 2015.
Furthermore
, all of the graphs have an
upwire
Correct your spelling
upward
trend except France.
According to
the chart, In 2005 almost 32 per cent of people do recycling in The United Kingdom.
In addition
, one
in fifths
Add a hyphen
in-fifths
show examples
of households perform recycling and in 2015 slightly over
than
Change preposition
apply
show examples
60 per cent performed recycling.
Moreover
, In 2011 almost 45 per cent
conduct
Wrong verb form
conducted
show examples
recycling,
also
In 2013 around one
in
Change preposition
apply
show examples
seconds
Fix the agreement mistake
second
show examples
of
regional
Add an article
the regional
show examples
household
Fix the agreement mistake
households
show examples
do
Wrong verb form
did
show examples
recycling. Plus, between 2007 and 2009 we do not have
a
Remove the article
apply
show examples
significant growth. In conclusion,
this
line graph illustrates what percentage of households conduct recycling. It is conspicuous
in
Correct word choice
that in
show examples
2005 France had the highest percentage,
while
in 2015 had the lowest percentage.
Moreover
, between 2007 and 2009 we do not have
a
Remove the article
apply
show examples
significant growth.
Submitted by bazarjanimohammadreza83 on

Unauthorized use and/or duplication of this material without express and written permission from this site’s author and/or owner is strictly prohibited. Excerpts and links may be used, provided that full and clear credit is given to Writing9 with appropriate and specific direction to the original content.

Sentences: Add more complex sentences.
Linking words: Don't use the same linking words: "moreover".
Introduction: The introduction is missing.
Introduction: Change the first sentence in the introduction.
Conclusion: The conclusion is too long.
Introduction: The chart intro is missing.
Common mistake: Your writing should be 150-250 words.
Introduction: The chart intro is missing.
Vocabulary: The word "graph" was used 3 times.
Vocabulary: The word "percentage" was used 3 times.
Vocabulary: The word "growth" was used 2 times.
Vocabulary: The word "almost" was used 2 times.
Vocabulary: The word "significant" was used 2 times.
Topic Vocabulary:
  • line graph
  • household recycling rates
  • trend analysis
  • comparison
  • significant
  • increase/decrease
  • fluctuations
  • plateau
  • progress
  • environmental implications
  • rate
  • peak
  • upward/downward trend
  • percentage
  • consistently
  • period
  • surpass
  • level off
  • stagnate
  • benchmark
  • time frame
  • sustainable practices
  • waste management
  • recycle
  • dispose
  • landfill
  • renewable resource
  • conservation
  • eco-friendly
  • green initiative
What to do next:
Look at other essays: