
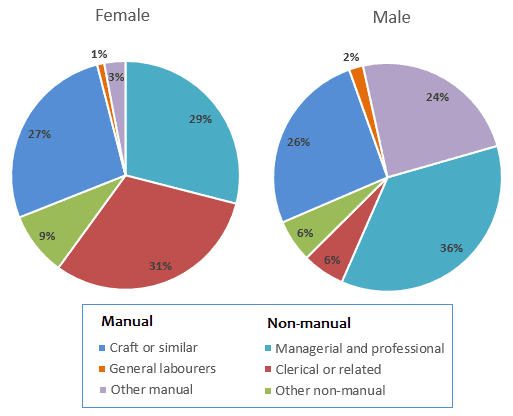
The pie charts compare the kinds of profession taken by females and males in Great Britain in the year 1992. The job sectors are divided into two groups (manual and non-manual) that are detailed into three kinds of jobs for each.
According to
the figures, women mostly worked in non-manual fields Linking Words
whereas
men preferred manual work. Linking Words
In addition
, craft, managerial, and professional opportunities made up a big part of both. In comparison, none of the gender groups had a big interest in general labour.
Linking Words
To begin
, almost a third of female workers were doing clerical or related careers. Linking Words
Furthermore
, 29% of them were a manager or a professional. At that time, 27% of women were making crafts, and only 9% of them were in other non-manual fields. Linking Words
Then
, a very small portion of females chose general labour and other manual activity.
In terms of male workers, nearly 40% of them took the managerial and professional path. The second-most of work field they were in was craft. Linking Words
In contrast
with the women, the proportion of men who are in other manual jobs is quite high, around making up a quarter. Linking Words
Then
, there was equally 6% of men who were doing clerical and other non-manual jobs Linking Words
while
only 2% of them were general labourers.Linking Words