
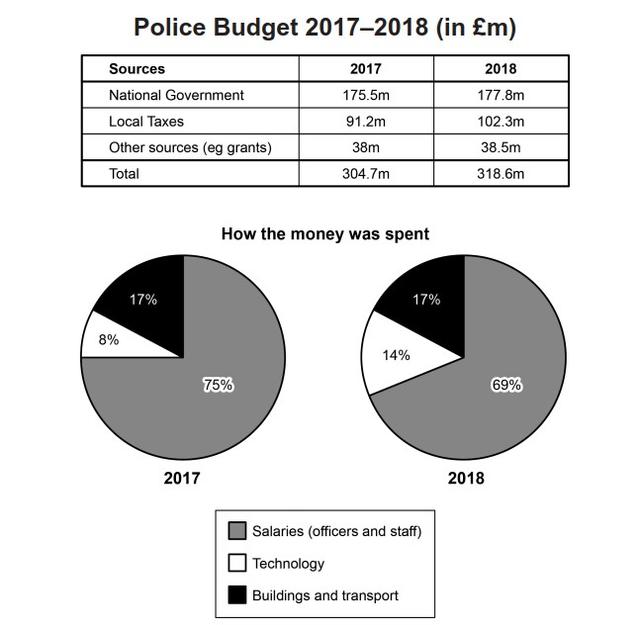
The above charts show the origins of the police budget between 2017 and 2018 in Britain,
as well as
provide the percentage of the budget allocation. These data sources clearly indicate the upward trend of funding, Linking Words
while
the distribution is greatly spent on police salaries.
The first table provides the capital sources to police are mostly comprised of the National Government with £175.5m in 2017 and a slight rise in 2018 up to £177.8m, notably almost double the other sources combined. Linking Words
This
is followed by local taxes contributing to the capital with £91.2m in 2017 and just under £103m in 2018. The Linking Words
last
component origin is “others” with exactly £38m in 2017 and approximately £0,5m addition in 2018.
The pie chart displays the spending of the money collected by law enforcers. The portions indicate that most of the allocation goes to salaries with 75% in 2017 and a decrease of under 70% in 2018. Meanwhile, technology received 8% of total money in 2017 and a 6 % minor increment in 2018. another recipient is the building and transport sector, receiving a constant 17% for both years analyzed.Linking Words