
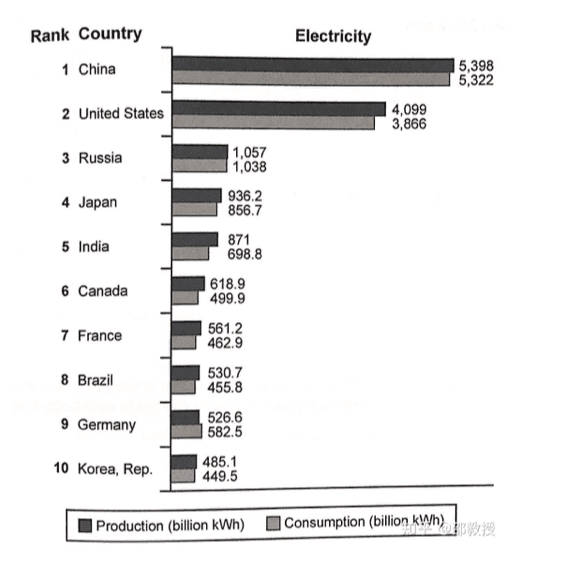
The chart illustrates the production and expenditure of
electricity
in the top 10 countries in the world in 2014.
Use synonyms
It is clear that
the attrition and generation of electric Linking Words
power
is highest in China and second highest in the United States. Other countries on the list have a relatively lower figure.
Use synonyms
According to
the bar chart, we can tell that the demand and supply of energy have a positive correlation. As the consumption of service grew, the output of electronic Linking Words
power
increased at the same time. Use synonyms
For example
, China had an Linking Words
electricity
consumption of 5322 billion Use synonyms
kWh
in 2014 which produced the highest yield net of Use synonyms
electricity
5398 Use synonyms
kWh
at the same time. Meanwhile, Korea consumed the smallest amount of Use synonyms
electricity
449.5 Use synonyms
kWh
compared to other communities on the list, which produced the least yield of Use synonyms
power
at 485.1 Use synonyms
kWh
in 2014.
Use synonyms
Overall
, almost all countries ranked among the graph have generally higher Linking Words
power
production than utilization, including China, the United States, Russia, Japan, India, Canada, France, Brazil and Korea, despite Germany, where the supply of energy was 526.6 Use synonyms
kWh
in 2014 which is lower than the 582.5 Use synonyms
kWh
of Use synonyms
electricity
consumed in the period.Use synonyms