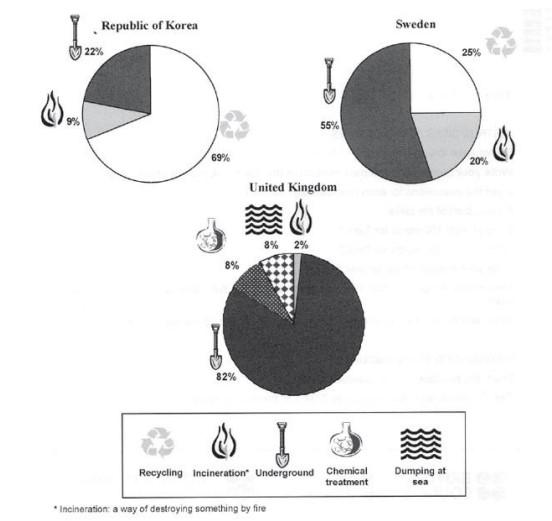
The pie chart below show how dangerous waste products are dealt with in three countries.

The pie chart below show how dangerous waste products are dealt with in three 

countries.
In
this
document we can see three charts that represent the different ways of destroying dangerous
waste
products in three countries, one represents the
Republic
of
Korea
, one
Sweden
population, and the other one represents the United
Kingdom
.
Firstly
, we can see that in the three countries, the dangerous debris is underground. In
Sweden
, in the United
Kingdom
and in the
Republic
of
Korea
, they incinerate their
waste
products.
Additionally
, the
Republic
of
Korea
and
Sweden
recycle their rubbish, but the United
Kingdom
does not. The United
Kingdom
is the country that buries the most of debris, 82%. But it is the United
Kingdom
that incinerates the least
waste
product with 2%.
Finally
, the
Republic
of
Korea
is the country that recycles most of its rubbish (69%). After the United
Kingdom
, it is
Sweden
(55%) and the
Republic
of
Korea
(22%) that buried the most debris. In comparison with the United
Kingdom
, the
Republic
of
Korea
incinerated (9%) and
Sweden
burnt (20%). To finish,
Sweden
recycles 25 % of their rubbish (the United
Kingdom
do not recycle their
waste
products 0%.)
Submitted by santos_dij on

Unauthorized use and/or duplication of this material without express and written permission from this site’s author and/or owner is strictly prohibited. Excerpts and links may be used, provided that full and clear credit is given to Writing9 with appropriate and specific direction to the original content.

Sentences: Add more complex sentences.
Basic structure: Change the second paragraph.
Basic structure: Change the third paragraph.
Vocabulary: Replace the words waste, republic, korea, sweden, kingdom with synonyms.
Vocabulary: Rephrase the word "undefined" in your introduction.
Vocabulary: Only 3 basic words for charts were used.
Vocabulary: The word "represent" was used 3 times.
Vocabulary: Use several vocabularies to present the data in the second paragraph.
Vocabulary: Use several vocabularies to present the data in the third paragraph.
What to do next:
Look at other essays: