
The
data
illustrates different types of ways Use synonyms
which
Change preposition
in which
people
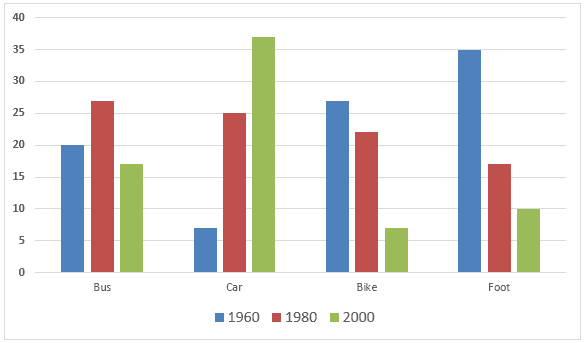
in one European city selected for going to work or travel in 1960, 1980 and 2000 respectively.
The Use synonyms
data
illustrates 4 different transport: Bus, Use synonyms
Car
, Bike and Use synonyms
Foot
values that Use synonyms
people
selected for going to work or travel. Use synonyms
Overall
, each year has different frequently used transport. The highest Linking Words
data
was "Use synonyms
Car
" in 2000 and the lowest was Use synonyms
also
"Linking Words
Car
" and "Bike".
Use synonyms
First,
the majority of Linking Words
people
used "Use synonyms
Car
" and "Use synonyms
Foot
". In 2000, the date of "Use synonyms
Car
" rated over 35 and it is more than 5 times of 1980's "Use synonyms
Car
" graph. The "Use synonyms
Foot
" in 1960 indicates accurately 35 and Use synonyms
this
is the highest bar involved in the "Linking Words
Foot
" article.
Use synonyms
Next,
there are two bars which had the lowest Linking Words
data
Use synonyms
overall
. The "Linking Words
Car
" in 1960 had more than 5 but lower than 10. Use synonyms
Moreover
, it recorded the lowest among the three years. Linking Words
As well as
Linking Words
this
value, the 2000's "Bike" had exactly the same graph which is over 5. Linking Words
Lastly
, in 1980, "Bus" appeared Linking Words
the
most popular way that Change preposition
as the
people
were transported which is over 25 and "Use synonyms
Foot
" was the lowest transport which was less than 20.Use synonyms