
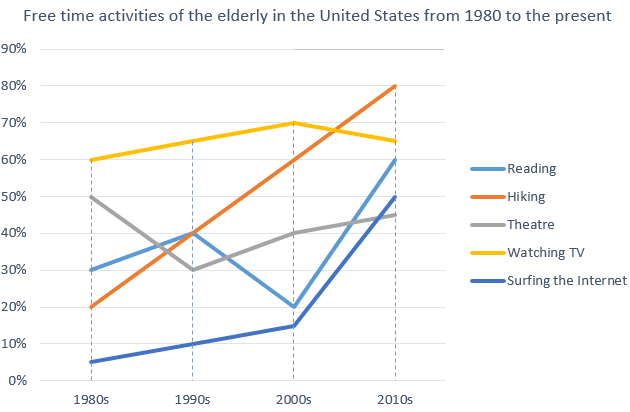
The graph illustrates the data about the leisure time
activities
of elderly people in the US, covering a period between 1980 and 2010.
Use synonyms
Overall
, what stands out from the graph is that the Linking Words
activities
listed have experienced some fluctuations, excluding hiking. The percentage of hiking popularity has been rising gradually over 30 years, and it ended up being the most popular activity among all 6 Use synonyms
activities
.
Looking at the details, in the first decade, the percentages of reading, hiking, watching Use synonyms
TV
, and surfing the internet rose noticeably. Use synonyms
While
watching Linking Words
TV
, surfing the Internet, and hiking have been increasing in 2000, the reading percentage experienced a significant decline to 20%. Use synonyms
Then
, the figure went up rapidly, finishing at 60%. Linking Words
Likewise
, surfing Linking Words
TV
and hiking increased, Use synonyms
however
, watching Linking Words
TV
faced a negligible fall to nearly 65%.
Use synonyms
However
, the popularity of going to theatres fell dramatically by 20%, in the first 10 years. Linking Words
Next,
the figure soared to 40% in 2000, Linking Words
then
it rose negligibly to approximately 45% in 2010, which made theatre the lowest in the list of Linking Words
activities
.Use synonyms