
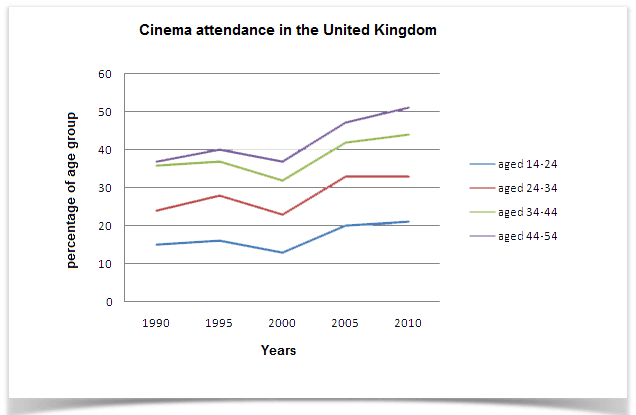
Remarkable information is provided regarding the rate of people who went to the cinema in the UK based on the age group, over a 20-year interval, commencing in 1990 and culminating in 2010 by the given graph.
From an
overall
view, it is obvious that all of the age groups experienced an increase. What’s more, the majority of film visitors were between 44 to 45 years old, Linking Words
while
the lowest rate was among those under 24.
By a closer examination, it can be seen that the proportion of people aged 34 to 54 was almost 36 Linking Words
percent
, in 1990. Meanwhile, those who were 24-34 and 14-24 years old, had much lower interest in cinema, which were approximately 25% and 15%, respectively.
Over the following 5-year period, all of the figures grew to a different extent, Change the spelling
per cent
however
, all of them declined to almost their start point in 2000. Within the next 10 years, cinema gained popularity among all age groups. Totally, over Linking Words
this
period, they all increased by 25%.Linking Words