
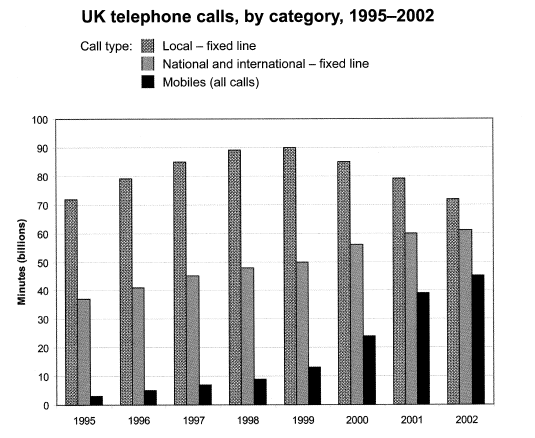
Depicted in the bar graph is the total number of minutes (in billions) of telephone calls in the UK. The data observed was divided into three categories,
such
as the local-fixed line, national and international-fixed line, and mobiles (all calls). Linking Words
Furthermore
, it can be seen that the data was observed from Linking Words
year
1995 to 2002.
Use synonyms
Overall
, it can be seen that all of the call types had some fluctuations over the years. The local-fixed line always had the highest amount of minutes of telephone calls. Linking Words
Besides
being the highest, it started and ended with the same amount of more than 75 billion. Linking Words
On the other hand
, even though mobiles had a significant increase in 2001, they still placed the Linking Words
last
in every Linking Words
year
's number of minutes. Use synonyms
Moreover
, mobile's peak was in 2001 with almost 60 billion.
Another noteworthy aspect is the stable increase of national and international fixed lines. The trend it had, starting from the Linking Words
year
1996 to 2002 never had a slight decrease. The number consistently increased Use synonyms
year
by Use synonyms
year
, maintaining its position in second place.Use synonyms