
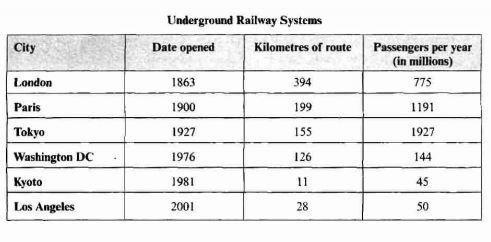
The table chart illustrates the statistics about the underground subway in six metropolitan cities, including their opening date, area,
Use synonyms
passengers
.
Correct word choice
and passengers
Overall
, it can be observed that Linking Words
London
Correct article usage
the London
metro
covered the most Use synonyms
track
Fix the agreement mistake
tracks
while
Kyoto took the least length.Linking Words
Further
, in terms of carrying Linking Words
passengers
Tokyo's Use synonyms
metro
was ahead of other cities.
Use synonyms
To begin
with, London's underground railway system was the first which was inaugurated in 1863 , had Linking Words
taken
a maximum journey , was 394km.It carried 775 Wrong verb form
took
million
commuters in a year which was in third rank.
In the 18th century , the Use synonyms
metro
was opened up in Paris , and it covered 199km which was half the distance in comparison to London's Use synonyms
metro
.In terms of Use synonyms
passengers
, it took 1191 Use synonyms
million
which was the second largest.In 1927, the underground railway station was facilitated in Tokyo ,where it had Use synonyms
the
path of 155km,Correct article usage
a
however
, Linking Words
passengers
had increased there , it was 1927 Use synonyms
million
which was the highest as compared to other cities.
Moving Use synonyms
Further
, in Washington DC , the subway was introduced in 1976, it took up a 126km road , which was larger than Los Angeles and Kyoto and when it comes to carrying travellers ,it took 144 Linking Words
million
per year.Use synonyms
Furthermore
,the Linking Words
metro
was opened in Kyoto in the 1980s , Not only it covered the least radius (11km), but Use synonyms
also
carried the lowest number of masses (45 Linking Words
million
). Use synonyms
Finally
, in 2001, an underground railway system was added , it had a route of 28km and 50 Linking Words
million
individuals travelled per year.Use synonyms