
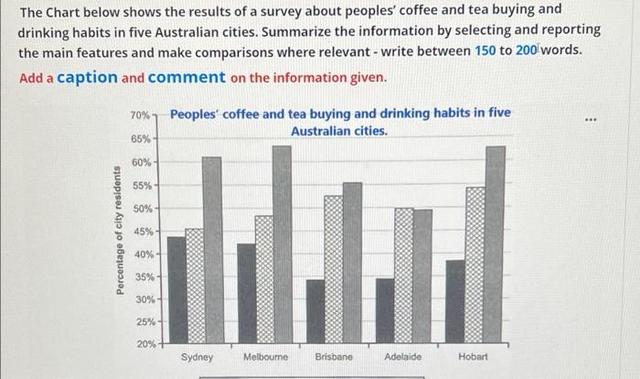
The graph displays the obtained information from a survey which is about how people preferred to purchase and drink
coffee
in five cities in Australia in the Use synonyms
last
Linking Words
four
weeks.
Use synonyms
Overall
it can be seen that going to a café to drink two caffeinated drinks, Linking Words
coffee
and tea, is the most popular way in all cities except Use synonyms
Adelaide
. Use synonyms
While
using instant Linking Words
coffee
is a bit more popular than drinking out for Use synonyms
Adelaide
, for Use synonyms
four
other ci4es is in second place Using fresh Use synonyms
coffee
is the least popular way in all ci4es. Use synonyms
also
, it can be seen that Melbourne is at the top of the list of Linking Words
coffee
consumers in Use synonyms
this
graph and Linking Words
Adelaide
is at the bottom of the list at all.
Use synonyms
According to
the results, on the top of the list around 64 Linking Words
Use synonyms
percent
of Melbourne’s residents prefer to go to a café to drink Change the spelling
per cent
coffee
, Use synonyms
this
number for Hobart is around 63 Linking Words
Use synonyms
percent
, after that Sydney with 61 Change the spelling
per cent
Use synonyms
percent
, and Brisbane with 56 Change the spelling
per cent
Use synonyms
percent
are in the third and fourth places respectively. Change the spelling
per cent
Adelaide
with 48 Use synonyms
percent
is in the Use synonyms
last
place.
Looking at the graph around 54 Linking Words
Use synonyms
percent
of Hobart’s residents bought instant Change the spelling
per cent
coffee
which is the highest percentage in the Use synonyms
last
Linking Words
four
weeks Use synonyms
after
there is Brisbane with 53 Correct word choice
apply
Use synonyms
percent
, Change the spelling
per cent
Adelaide
with 50 Use synonyms
Use synonyms
percent
, and Melbourne with 48 Change the spelling
per cent
Use synonyms
percent
respectively. Sydney with 46 Change the spelling
per cent
Use synonyms
percent
has the lowest percentage of instant Change the spelling
per cent
coffee
consumption in the Use synonyms
last
Linking Words
four
weeks.
44 Use synonyms
Use synonyms
percent
of Sydney’s people prefer fresh Change the spelling
per cent
coffee
, Melbourne with 43 Use synonyms
Use synonyms
percent
and Hobart with 38 Change the spelling
per cent
Use synonyms
percent
are in Change the spelling
per cent
the
third and fourth place. Correct article usage
apply
this
number for Brisbane and Linking Words
Adelaide
is 34 Use synonyms
Use synonyms
percent
.Change the spelling
per cent