
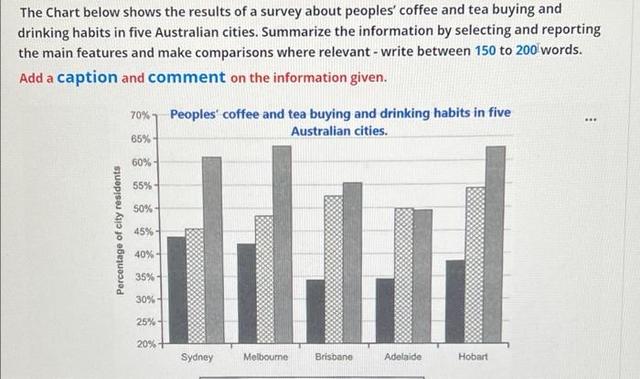
The given bar chart illustrates the outcomes of the research on public purchases of caffeine and tea among five cities in Australia (Sydney, Melbourne, Brisbane, Adelaide, Hobart).
Overall
, it can be observed that more than three-fifths of the population in given cities prefer to visit cafes for drinking, Linking Words
while
fresh cappuccino buyers account for less than two-fifths.
Analyzing the provided data, people in Sydney, Melbourne and Hobart tend to go out more to have beverages. Following that, the statistical percentage demonstrates almost two-thirds in all three cities. Instant caffeine is the second most popular option for more than two-fifths of Linking Words
the
people. Correct article usage
apply
Lastly
, the least interesting choice is buying fresh coffee Linking Words
according to
the information.
Turning to the other two towns, it can be indicated that the majority of the people who like to sip coffee and tea constitute less than a third of the total. Ultimately, the number of Australians choosing to buy instant coffee and enjoy drinking in restaurants is about fifty per cent.Linking Words