
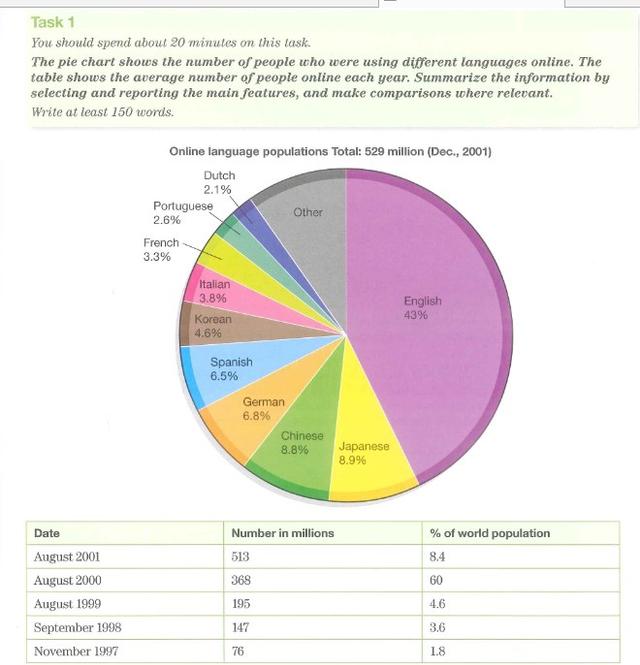
Represented figures reflect shares of people learning foreign languages online in December 2001. Among them, the most popular are English, Japanese, Chinese, German, etc. The table exhibits these statistics in terms of the percentage of the world population in different periods of time being online,
such
as 1997, 1998, 1999, 2000 and 2001.
First of all, speaking of the pie chart, we can make a conclusion that the most common one for learning online is English, which takes about half, 43%, Linking Words
whereas
others have approximately similar shares as each other. Linking Words
For instance
, Japanese - 8,9%, Chinese - 8,8%, German - 6,8%, Spanish - 6,5%, Korean - 4,6%, Italian - 3,8%. Others take neat to 1-3% only.
Linking Words
Secondly
, we have another part of the evidence which displays the whole data without dividing it into groups as the previous one. Linking Words
Thus
, with the population growth the share of people learning them increased as well, from 1,8% in November 1997 to 8,4% in August 2001.
Linking Words
Finally
, the first source of information in comparison to the second tells us that almost all people online use the Internet for learning languages.Linking Words