
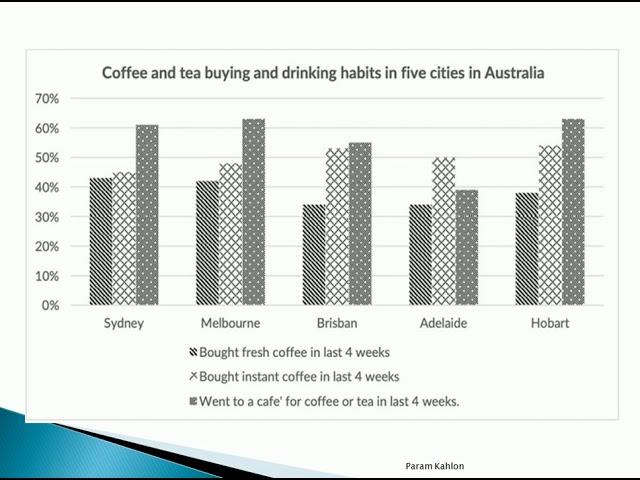
The given bar chart illustrates the survey's outcomes regarding consumers'
coffee
and tea purchasing and drinking habits in Australia in the Use synonyms
last
4 weeks.
Linking Words
Overall
, Linking Words
it is clear that
most people in Australia prefer to purchase Linking Words
coffee
or tea from a cafe to buy instant Use synonyms
coffee
. Use synonyms
In contrast
, the number of people who bought fresh Linking Words
coffee
was consistently the lowest in all cities.
The most interesting feature that emerges from the chart is that the Use synonyms
proportion
of drinking in a cafe was generally the greatest, mainly in Melbourne, Sydney, and Hobart. It varies between 65% and 60%. Meanwhile, in the other two cities, Brisbane and Adelaide, it accounted for half of the population.
Regarding the habit of consuming instant Use synonyms
coffee
, the Use synonyms
proportion
was 15% lower than in cafes in Sydney and Melbourne. In Brisbane, Adelaide, and Hobart, the Use synonyms
proportion
stood at around 50% to 55%. Use synonyms
On the other hand
, as the lowest Linking Words
proportion
, fresh Use synonyms
coffee
ranged from 35% to 43%, with Sydney as the highest.Use synonyms