
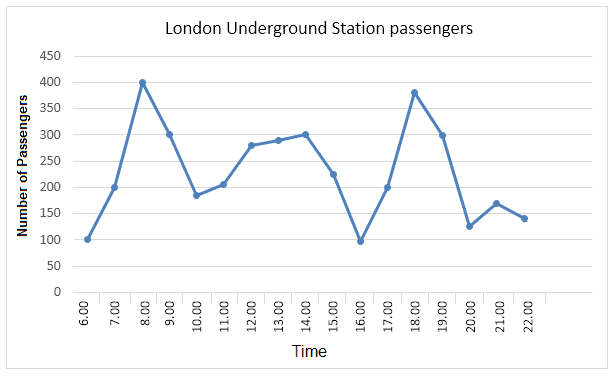
The given line chart introduces the number of
commuters
in the London Underground Station during the day.
Use synonyms
According to
the data, the number of people between 6 am and 10 am was almost the same as over the period 4 Linking Words
pm
to 8 Use synonyms
pm
. It is noteworthy, that the figures during the afternoon and in the evening fluctuated.
Looking at the details more closely, there were 100 passengers at 6 am and 4 Use synonyms
pm
. Comparing these two time periods, the number of Use synonyms
commuters
rapidly increased and reached the highest points of the day at 8 am and 6 Use synonyms
pm
- 400 and 380 people respectively. Use synonyms
Then
, there were sharp declines which comprised 180 passengers at 10am and 125 Linking Words
commuters
at 8pm.
The information in the graph reveals, that after 10 am the level of London Underground Station users gradually rose and amounted to about 280 passengers at 12 sharp. Use synonyms
In addition
, between midday and 2 Linking Words
pm
, the figures remained steady. Use synonyms
However
, during the next two hours, there was a steep decrease, making 100 people at 4 Linking Words
pm
. Regarding the period from 8 Use synonyms
pm
to 10 Use synonyms
pm
,Use synonyms
a
slight upward and downward trends are seen, resulting in 140 Correct the article-noun agreement
apply
commuters
.Use synonyms