
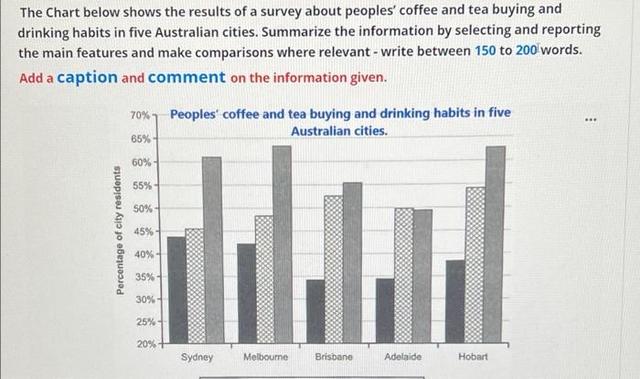
The bar chart displays the percentage of
residents
who bought and drank Use synonyms
coffee
and tea in Sydney, Melbourne, Brisbane, Adelaide, and Hobart for the Use synonyms
last
4 weeks.
Linking Words
Overall
, most people living in those cities went to a cafe for Linking Words
coffee
or tea for the previous month. Some Use synonyms
residents
prefer buying Use synonyms
instant
Use synonyms
coffee
rather than fresh Use synonyms
coffee
over the past month.
The proportion of people going to cafes to enjoy caffeine drinking Use synonyms
such
as Linking Words
coffee
or tea is way higher than those buying Use synonyms
instant
Use synonyms
coffee
. Use synonyms
This
situation is pretty much the same for all cities in Australia, except for Adelaide which shows a similar ratio of Linking Words
residents
going to cafes and purchasing Use synonyms
instant
Use synonyms
coffee
. More than 60% of the population living in Sydney, Melbourne, and Hobart going to cafes for the previous 4 weeks.
Most people in those five cities purchase and drink more Use synonyms
instant
Use synonyms
coffee
than freshly brewed Use synonyms
coffee
. Use synonyms
However
, around 45 per cent of Sydney's Linking Words
residents
purchase either Use synonyms
instant
or regular Use synonyms
coffee
.Use synonyms