The table below shows the numbers of visitors to Ashdown Museum during the year before and the year after it was refurbished. The charts show the result of surveys asking visitors how satisfied they were with their visit, during the same two periods. Summarise the information by selecting and reporting the main features, and make comparisons where relevant.

The table below shows the numbers of visitors to Ashdown Museum during the year before and the year after it was refurbished. The charts show the result of surveys asking visitors how satisfied they were with their visit, during the same two periods.

Summarise the information by selecting and reporting the main features, and make comparisons where relevant.
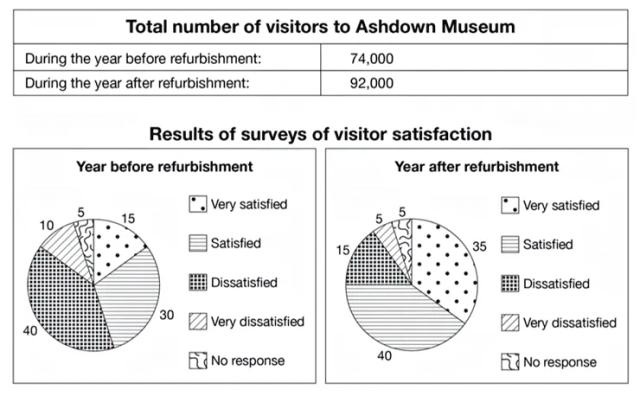
The table depicts visitor numbers of Ashdown Museum
while
the pie charts illustrate the survey given to
visitors
asking about the level of satisfaction during their visit. The statistics are taken from years before and after the refurbishment of the museum. It was shown that in the year following, more people were going to the museum and they were generally more satisfied during their visit. In the case of the figures in the table, the number of
visitors
was increasing from 74.000 to 92.000. There was a rise to 18.000
visitors
after the renovations. Turning to the pie charts, it can be seen that the percentage of
visitors
who feel very satisfied and satisfied rose considerably from 45% before the refurbishments to 75% after.
In contrast
, the proportion of those who are dissatisfied and very dissatisfied dropped more than half, from 50% before the changes to 20% after. The number of people who gave no response to the survey remained unchanged still 5% in both years.
Submitted by misstiasclassroom on

Unauthorized use and/or duplication of this material without express and written permission from this site’s author and/or owner is strictly prohibited. Excerpts and links may be used, provided that full and clear credit is given to Writing9 with appropriate and specific direction to the original content.

Vocabulary: Rephrase your introduction. Words match: 77%.
Vocabulary: Replace the words visitors with synonyms.
Vocabulary: Rephrase the word "numbers of" in your introduction.
Vocabulary: The word "charts" was used 2 times.
Vocabulary: The word "table" was used 2 times.
Vocabulary: The word "give" was used 2 times.
Vocabulary: The word "numbers of" was used 3 times.
What to do next:
Look at other essays: