
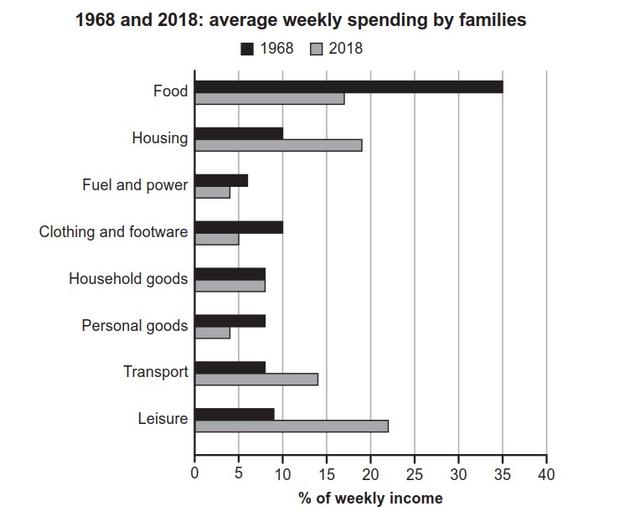
The given bar graph illustrates how a state's families maintained their income
on
different domestic sectors in 1968 and 2018.
Change preposition
in
Overall
, The rates of residents' spend on housing, transport, and leisure showed Linking Words
upward
trend, Add an article
an upward
whereas
food, fuel and power, clothing and Linking Words
footware
, and personal Correct your spelling
footwear
goods
followed the opposite trend over the given period.
In 1968, the people spent Use synonyms
majority
of their earnings on purchasing food, which accounted for 35%; leisure, Add an article
the majority
in contrast
, had become the highest expenditure source, at 22% in 2018, and the percentages of transport and housing followed a similar trend as leisure; these were 10% and 9% in 1968, and 19% and 14% in 2018. The proportion of fuel and power and personal Linking Words
goods
was almost similar, at 4% in 1968; Use synonyms
however
, Linking Words
then
they started to increase and reached 6% and 9% for fuel and power and personal Linking Words
goods
, in the year 2018, respectively. Spending on household Use synonyms
goods
remained unchanged over the given fifty-year period.Use synonyms