
The bar graph represents the proportion of car travelling done by males and females for their aim.
Overall
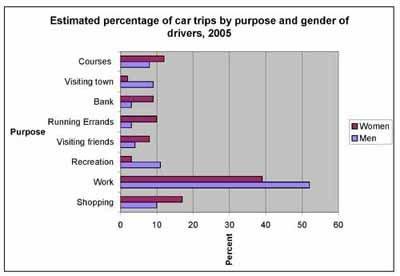
, it can be observed that feminine were the least , who visited the town , masculine most travelled for work.
The most striking feature of the graph is that the number of Linking Words
female
was decreased in visiting town and recreation.Change to a plural noun
females
However
, men had the maximum ratio for both purposes.In terms of courses , women had the Linking Words
more
percentage Correct word choice
highest
than
men (12%, and 8% respectively). Change preposition
of
Furthermore
, both Linking Words
gender
had the almost same proportion in the bank and running errands.
Moving on to the remaining information, the statistics of females and males for the plan of visiting friends were circa 8% and 5%, respectively.Fix the agreement mistake
genders
Moreover
, the percentage of both genders hand substantially rose in work, which was 40% for women and around 53% for males.Linking Words
Finally
, Linking Words
in
the Change preposition
on
last
trip , which was for shopping, the feminine had more ratio as compared to the masculine.Linking Words