
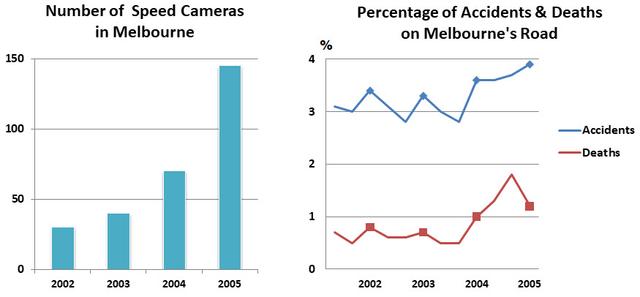
The bar chart represents the data on the
amount
of Change the quantifier
number
speed-cameras
in Melbourne between 2002 and 2005, Correct your spelling
speed cameras
whether
the line graph compares the statistics of deaths and Correct word choice
and
accidents
in the same period.
Use synonyms
Overall
, most of the speed-cameras were Linking Words
edtablished
in 2005, Correct your spelling
established
while
the least number was in 2002. Linking Words
Additionally
, the peak of mortality rates Linking Words
occured
between 2004 and 2005, reaching the biggest proportion of Correct your spelling
occurred
accidents
in 2005.
Use synonyms
To begin
, looking at the bar graph, 25 cameras were placed in the city in 2002, followed by around 35 in 2003. It becomes obvious that Linking Words
due to
many Linking Words
accidents
happened in 2004, more cameras were provided in that year, at approximately 60, achieving the greatest number of 150 in 2005.
Use synonyms
According to
the line graph, slightly above 3% of Linking Words
accidents
were recorded at the start of the period, fluctuating to about 3,5% and back till 2004, gradually moving up to slightly under 4%. Even though mortality rates were considerably low from 2002(below 1%) to 2004, at 1%, the proportion of deaths had jumped to just under 2% after 2004 and Use synonyms
then
went back to lightly above 1%.Linking Words