
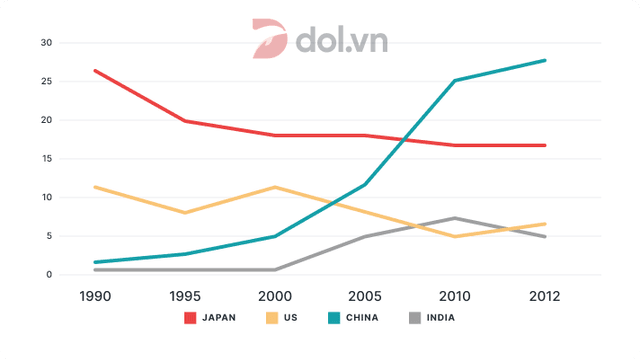
The line graph illustrates
exports
from Australia to Use synonyms
Japan
, the US, China and India in 12 years.
Use synonyms
Overall
, it can be seen that there were upward trends in the percentage of Linking Words
Japan
and the US Use synonyms
exports
, Use synonyms
while
the opposite was true in China and India Linking Words
exports
.
Use synonyms
To begin
with, there were around 26% of Australia’s Linking Words
exports
to Use synonyms
Japan
in 1990, reaching the highest, but its figure significantly declined to under 20% after 12 years. A similar can be seen in Use synonyms
Japan
's export figure, which fluctuated at the level of 15 to 25 % in the period of time.
Use synonyms
On the contrary
, Linking Words
although
Australian Linking Words
exports
to China ranked third in the list of 1990, it showed a sharp increase from 3% to 10 times higher in 2012, surpassing the US and Japanese Use synonyms
exports
. Use synonyms
Besides
, India's export figure remained unchanged at a percentage of under 10% after 12 years, despite its increasing tendency.Linking Words