
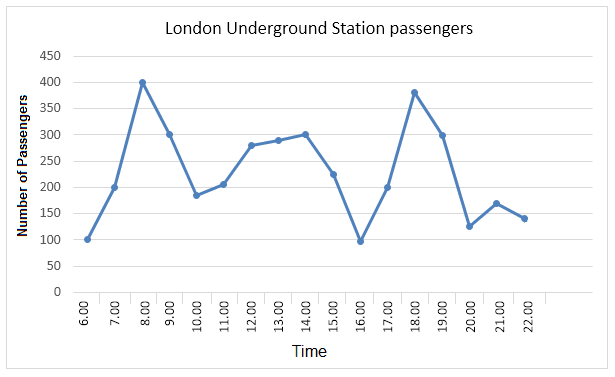
The chart illustrates the
number
of Use synonyms
passengers
in Use synonyms
London
underground stations around sixteen hours. It can be seen, the line chart experiences up and down.
Looking more closely at the chart, most of the highest Use synonyms
number
of Use synonyms
passengers
in Use synonyms
London
Use synonyms
station
is the Use synonyms
time
when Use synonyms
people
are going home and the Use synonyms
time
when Use synonyms
people
go to work. Use synonyms
Moreover
, there is the peak Linking Words
time
of the Use synonyms
London
Underground Use synonyms
station
. It is noticeable that the peak Use synonyms
time
is divided into three sections. Use synonyms
whereas
, the lowest percentage of Linking Words
passengers
in Use synonyms
London
Use synonyms
station
is divided into Use synonyms
two
sections.
The first peak Use synonyms
time
at Use synonyms
London
Use synonyms
station
is at 8.00 in the morning. At 6 am the average of one hundred Use synonyms
passengers
started but in Use synonyms
two
hours the Use synonyms
number
of Use synonyms
passengers
rose to four hundred Use synonyms
people
. Use synonyms
Moreover
, in the next Linking Words
two
hours, the Use synonyms
number
of Use synonyms
passengers
fell, Use synonyms
less
than 200 Change preposition
to less
people
at 10.00 am.
About the Use synonyms
time
10.00-16.00, there is upward down steadily, from Use synonyms
two
hundred Use synonyms
people
and up to three hundred Use synonyms
people
and fallen until one hundred Use synonyms
passengers
at 16.00.Use synonyms