
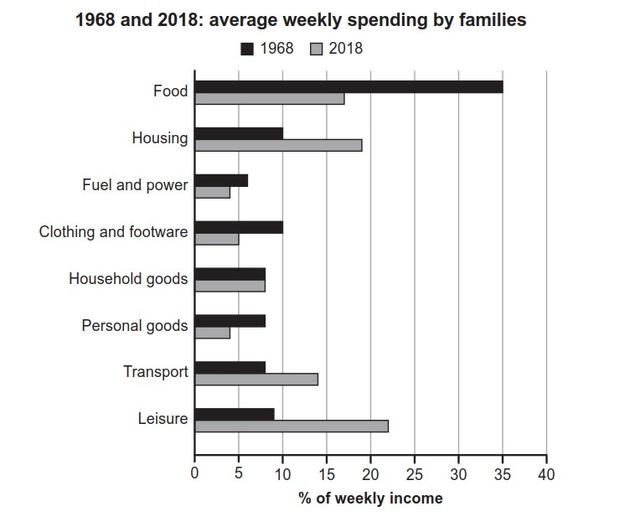
The bar graph details
average
spending per week for Correct article usage
the average
household
in a given country in the years 1968 and 2018.
Fix the agreement mistake
households
Overall
, Linking Words
it is clear that
leisure activities had the highest share in average consumption costs of each family, Linking Words
while
that of food was the least.
In 1968, families spent most on food, Linking Words
according to
35 % of their weekly income. Linking Words
Moreover
, expenditures on housing, clothing and footwear each accounted for 10 % of the weekly income. Linking Words
In addition
, the costs of personal goods, transport, and leisure activities became more similar, with components standing between 6 and just over 8 per cent.
In 2018, the average prices of leisure had the largest portion of consumption at around 23 per cent, Linking Words
whereas
average spending on fuel and power, personal goods and clothing and footwear all had a depletion to no more than 5 %. Linking Words
Although
the pattern of food, housing and transport were noticeably different, money spent on household goods remained at roughly 7%.Linking Words