
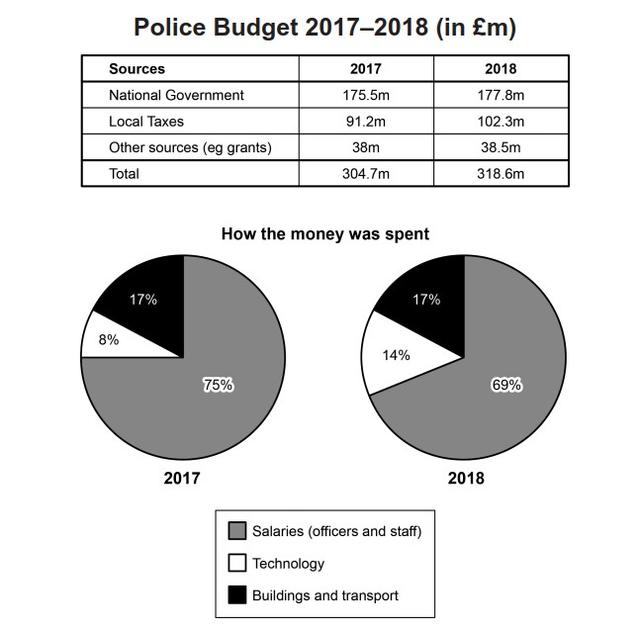
The data is presented in the form of a
pie
Use synonyms
chart
and a Use synonyms
table
, illustrating the Use synonyms
government
expenditure fund and how it is allocated among three categories of expenditures from 2017 to 2018. Use synonyms
While
the Linking Words
pie
Use synonyms
chart
provides information about the proportion of money expended on three distinct categories, the Use synonyms
table
indicates the sources of these allocations.
Notably, the most significant category in the Use synonyms
pie
Use synonyms
chart
is buildings and transport, which comprise the majority of the allocation proportion. The budget, expressed in millions of pounds, was predominantly comprised of national Use synonyms
government
sources.
It can be clearly seen from the Use synonyms
table
that the Use synonyms
government
fund has Use synonyms
been
increased in 2018 compared to 2017. The category that saw the most significant increase was local taxes, with an approximate rise of ten million pounds.
When comparing the Unnecessary verb
apply
pie
Use synonyms
chart
and Use synonyms
table
, it is evident that the increased amount of money is observed as a surge in the allocation of technology. Use synonyms
Conversely
, the proportion distributed to salaries witnessed a seven Linking Words
precent
decrease.
Based on the information from both charts, it can be concluded that Correct your spelling
per cent
as a consequence
of the increased Linking Words
government
Use synonyms
fund
, the technology expenditures experienced an expansion.Fix the agreement mistake
funds