
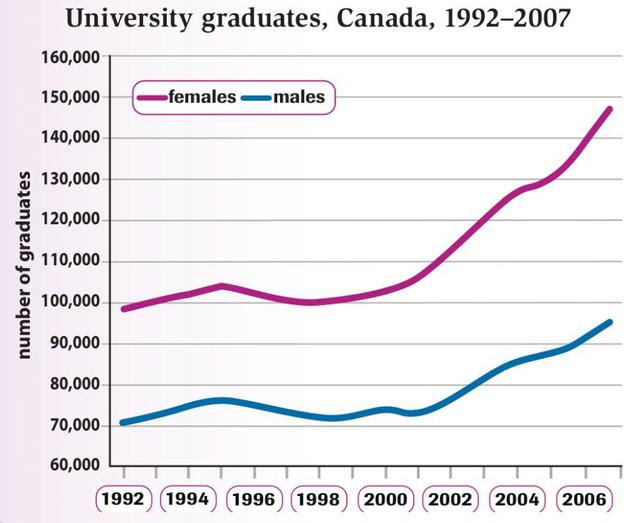
The line graph gives information on the graduated students, females and males who studied in Canadian universities between 1992 and 2007.
Overall
, the two lines tend to have identical patterns after over a decade of observations. Linking Words
In contrast
, it is noticeable that there was a considerable increase in the number of female graduates, Linking Words
while
the latter inclined slightly Linking Words
at the end
of the period.
In 1992, women shared the biggest percentage of participants at the graduation ceremony when compared to male participation, 98.000 versus 70.000 people. Their number Linking Words
then
grew gradually by 1% in the next three years, before it decreased moderately to a nearly similar level as the initial year between 1998 and 2000.
Linking Words
In addition
, in the following two years, their level went up slowly before the number of graduated females reached a peak in 2007, accounting for 145.000 people, which was over one-third of the male population.Linking Words