
The bar chart compares how families in one country spent their
money
in two Use synonyms
years
1968 and 2018 which are Use synonyms
fifty
Use synonyms
years
apart.
Use synonyms
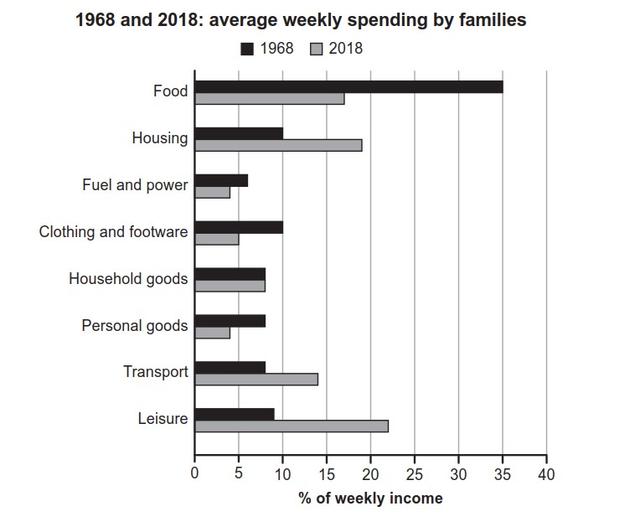
Overall
, the most Linking Words
money
had been spent on Food back to 1968. Weekly income which was spent on Household goods remained the same amount during these 50 Use synonyms
years
.
As mentioned, the most weekly income which was 35 Use synonyms
percent
, was Change the spelling
per cent
being
spent on Food back Unnecessary verb
apply
to
1968, Change preposition
in
while
, Linking Words
fifty
Use synonyms
years
later, Use synonyms
this
amount halved in 2018. Income which was being spent on Housing was 10 Linking Words
percent
in 1968 Change the spelling
per cent
while
it doubled 50 Linking Words
years
later. Fuel and power was the lowest proportion in both 1968 and 2018.
Use synonyms
According to
the bar chart, the Linking Words
money
which was being spent on Clothing and Use synonyms
footware
Correct your spelling
footwear
,
was Remove the comma
apply
one tenth
of the total in 1968 and it halved to 5 Add a hyphen
one-tenth
percent
in 2018. Household goods remained the same proportion in these Change the spelling
per cent
fifty
Use synonyms
years
. The most Use synonyms
money
in 2018 was spent on Leisure. Transport Use synonyms
was
Unnecessary verb
apply
also
rose after Linking Words
fifty
Use synonyms
years
.Use synonyms