
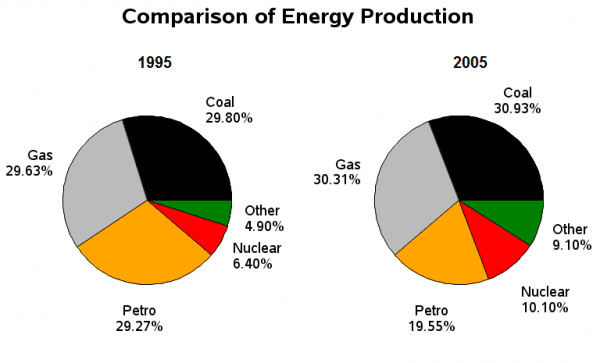
The pie charts below represent information about types of energy production in France in two years.
Overall
, it is evident that butter and margarine showed the biggest Linking Words
diffences
between those years.
To commence with the statistics of Margarine showed gradual fluctuation, which accounted for 140 grams in 1981.Correct your spelling
differences
Then
it fell in 1991 and comprised 100 and there was the same Linking Words
trend
until 2007, which made up about 55, Use synonyms
consequently
.
When it comes to the opposite Linking Words
trend
, which was statistics of Butter.Use synonyms
Firstly
it started in 1981 and made up approximately 97 grams and Linking Words
then
there was dropped in 1986, which accounted for 80. Linking Words
Furtermore
there was Correct your spelling
Furthermore
up
Correct article usage
an up
trend
, which made up 100 until 2000 .Use synonyms
Moreover
, in 2001 the number Linking Words
was reduce
Change the verb form
was reduced
for
about 80 and Change preposition
to
then
comprised 40 in 2007.
It may be concluded from the pie chart that Margarine showed Linking Words
Correct article usage
a fluctuation
fluctuation
Replace the word
fluctuating
trend
, Use synonyms
whereas
Butter had the opposite Linking Words
trend
.Use synonyms