
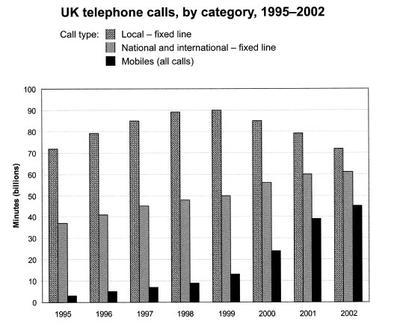
The bar chart illustrates how many minutes were spent on telephone calls in three different categories between 1994 and 2001 in the UK. Units are measured in billions.
Overall
, throughout the Linking Words
period
Local calls were dominated, Use synonyms
while
the rate was for mobile.Linking Words
Linking Words
Also
Add a comma
Also,
it is clear that
the gap between categories shrank after half of the Linking Words
period
.
Regarding the Local-fixed line, despite the increase to the half of given Use synonyms
period
, the figure returned to the start indicated.There was a gradual increase with just under 75 Use synonyms
billion
to about 90 Use synonyms
billion
from 1994 to 1998, respectively.Use synonyms
However
,it saw a slight decrease to about 70 Linking Words
billion
by 2001.Use synonyms
Whereas
, the popularity of national and international calls rose steadily during the Linking Words
period
, climbing from approximately 35 Use synonyms
billion
minutes utilized Use synonyms
of
Change preposition
apply
them
to 60 Correct pronoun usage
apply
billion
in 1994 for the former and 2001 for the latter.
Focusing on mobile phones, the number of minutes spent on Use synonyms
this
form of telecommunication was roughly 2 Linking Words
billion
in 1994, the lowest figure in all given years.The figure for it experienced considerable growth reaching 12 Use synonyms
billion
in 1998.The mobile calls rocketed to finish at around 44 Use synonyms
billion
in 2001Use synonyms