
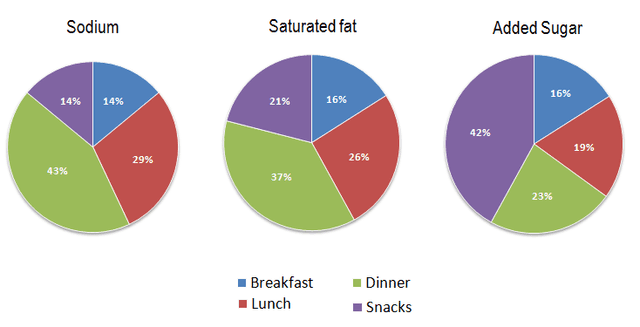
These pie charts illustrate how much a person consumes three types of nutrients
sodium
, saturated fat, and added Use synonyms
sugar
in every meal on a normal day. The data is in percentage.
Use synonyms
Overall
, it is noticeable that each person tends to have more of their daily Linking Words
sodium
and saturated fat by having Use synonyms
dinner
, Use synonyms
however
, the highest percentage of Linking Words
sugar
consumption is by having Use synonyms
snacks
.
Starting off with Use synonyms
sodium
, most individuals have Use synonyms
this
nutrient with their Linking Words
dinner
which contains 43% of all the meals. Breakfast and Use synonyms
snacks
, Use synonyms
however
, each contain only 14% of the whole amount of Linking Words
sodium
consumption. Moving on to saturated fat, these kinds of nutrients, Use synonyms
moreover
, can be found mostly in Linking Words
dinner
with 37% of all, Use synonyms
as well as
, lunch to be in the second level with more than one-fifth. Linking Words
On the other hand
, added Linking Words
sugar
is mostly consumed by having Use synonyms
snacks
on a daily basis. As is shown in the Use synonyms
last
pie chart, 42% of our daily Linking Words
sugar
is found in Use synonyms
this
meal, Linking Words
although
, breakfast has the least amount of Linking Words
sugar
with 16% for starting off the day.
In conclusion, people are more likely to consume Use synonyms
sodium
and fat in their Use synonyms
dinner
, Use synonyms
however
, Linking Words
snacks
have the highest percentage of added Use synonyms
sugar
.Use synonyms