
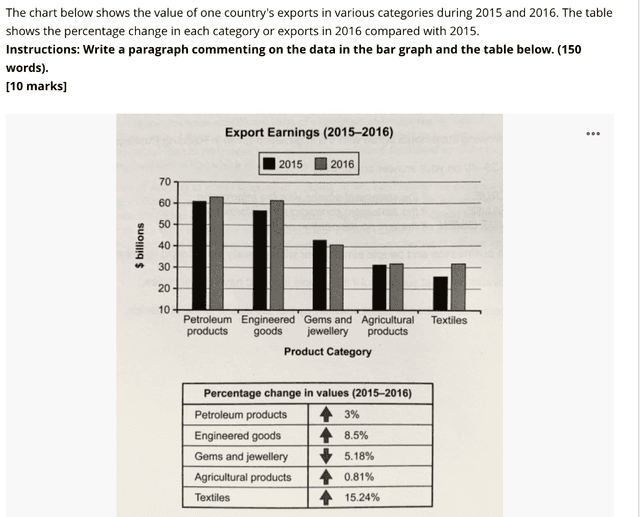
The given chart provides insight into one country’s exports within the diverse categories in the span of 2015 to 2016
whereas
the table showcases the percentage alteration in the respective exports and compares both two years.
Linking Words
Overall
, it can be clearly seen that in both years the highest percentage of the export revenues belongs to petroleum products among other categories.
First of all, during the time frame 2015 to 2016, the demand for textiles increased and Linking Words
this
change is explained by 15.24% which corresponds to roughly five billion Linking Words
dollar
. totally. Meanwhile, the profit of Change to a plural noun
dollars
egerms
and jewellery have experienced a decrease which corresponded 5.18%.
Correct your spelling
germs
gems
Secondly
, when it comes to the exportation number of agricultural products, the percentage of its alteration is a testament to its constant remain during Linking Words
this
period. The exportation of engineered goods has increased by approximately five billion dollars akin to textiles.Linking Words