
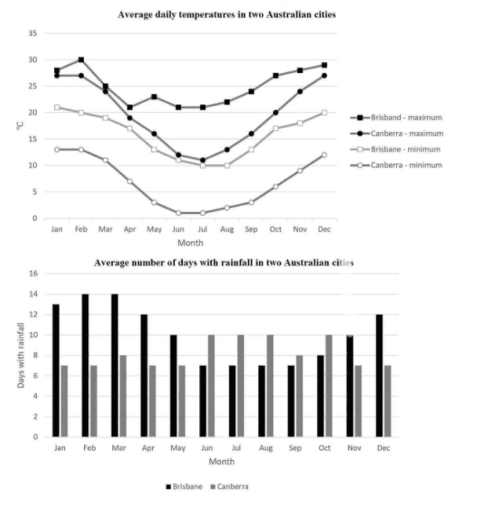
The line chart illustrates both cities Brisbane and
Canberra
with respect to average daily temperatures. Use synonyms
Also
, the bar graph demonstrates the number of rainy days in the same cities as well. Linking Words
Overall
, it is clear from the data above that Brisbane has the highest temperature compared with Linking Words
Canberra
, specifically in the second month of the year, with respect to 30 degrees. Use synonyms
While
Linking Words
Canberra
has noticed to be the lowest in Jun.
As shown there has been a significant decrease in the temperature of the Use synonyms
Canberra
- minimum line, starting with Feb and ending in Jun followed by the same value of changes but with an upward increase. Use synonyms
Canberra
- maximum line has decreased so dramatically, from 27 to 10.5 degrees in Feb until Jul respectively.
Use synonyms
On the other hand
, the rainfall in Linking Words
Canberra
has maintained the same level in terms of the first month to the end of May. But In Brisbane Jan, Feb and Mar have presented an enormous number of rainfall days which reached 14 days.Use synonyms