
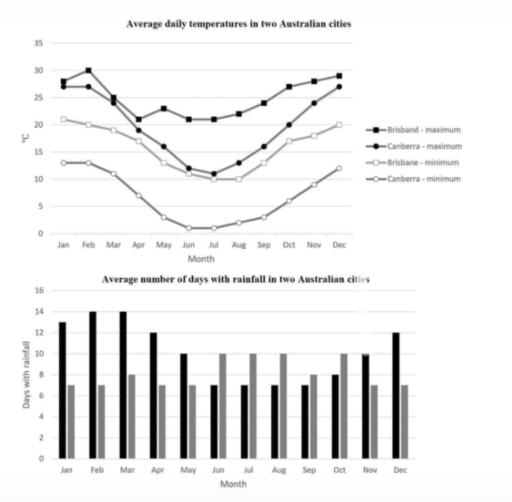
The presented charts illustrate the average temperatures on a daily basis and the number of rainy
days
in two various Use synonyms
cities
in Australia.
Use synonyms
Overall
, it can be seen that in the first six months of the Linking Words
year
, the temperatures decreased in Use synonyms
both
Use synonyms
cities
and Use synonyms
then
rose to the end of the Linking Words
year
. Use synonyms
Additionally
, rainy Linking Words
days
in Use synonyms
Brisbane
were more than in Canberra in all mentioned years except a period from June to October.
In detail, in Jan the maximum temperature for Use synonyms
both
Use synonyms
cities
was 27C. Use synonyms
Moreover
, in the six following months fall trends can be observed, before climbing to near 30C Linking Words
at the end
of the Linking Words
year
. Use synonyms
Furthermore
, in January, the minimum degree for Linking Words
Brisbane
and Canberra was almost 20C and 12C respectively, Use synonyms
while
Linking Words
both
places witnessed decline trends until they reached 10C and almost Ziro in July respectively. After that, Use synonyms
both
Use synonyms
cities
' temperatures increased and reached the same degrees as in January.
In terms of rainy Use synonyms
days
, the most rainy Use synonyms
days
of a month belonged to Feb and Mar in Use synonyms
Brisbane
with 14 Use synonyms
days
, and Use synonyms
then
Linking Words
days
with rainfall declined to 7 Use synonyms
days
from June to September. Use synonyms
Brisbane
witnessed 12 Use synonyms
days
of rainfall in Dec again. Use synonyms
In addition
, in Canberra, the average number of rainy Linking Words
days
was from June to October about 10 Use synonyms
days
, Use synonyms
whereas
the other months of the Linking Words
year
experienced rainfall almost a week monthly.Use synonyms