
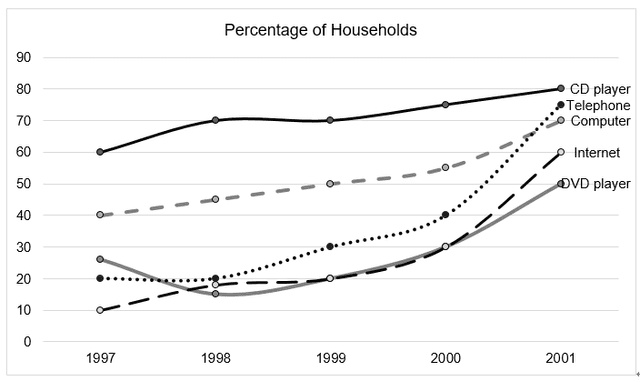
The provided line graph gives information about four distinctive sorts of technology in households in Britain between 1997 and 2001. The data is given in percentages and can be split into two groups, an upward and downward trend of the usage of technological appliances.
Overall
, Linking Words
it is clear that
the number of CD players was the highest proportion of all applications, Linking Words
whereas
the player of DVD was the least popular technology.
In terms of the player's CD, it started at 60, Linking Words
then
there was a significant growth in the people's households, which reached a peak at 80 Linking Words
percent
. Regarding the computer, The higher of people who used a computer with 40 % during the period of 1997 than telephone users by 20 Change the spelling
per cent
percent
. Ultimately, in the next 4 years, the percentage of using phones increased markedly by approximately 78% which witnessed a skyrocket rather than computers by roughly 10 %.
Moving to the usage of DVD players, despite starting higher point than the Internet, fewer people spent it than the Internet in 2001.Change the spelling
per cent