
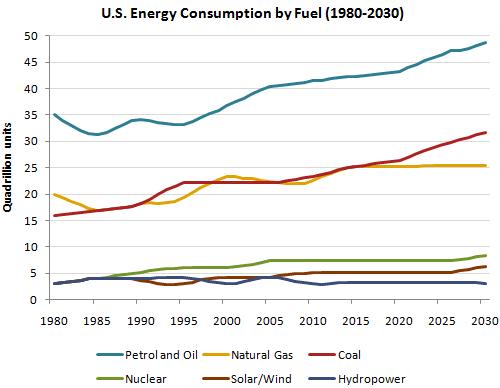
The line chart reveals the consumption of six different kinds of energy per year in the USA from 1980 to the predicted 2030.
Overall
, the vast majority of energy use in America was Linking Words
petrol
and Use synonyms
oil
in the given time whilst the use of hydropower was mostly the least in the given 5 decades.
Use synonyms
According to
the information shown in the graph, Americans relied on Linking Words
petrol
and Use synonyms
oil
the most which was estimated to peak at 50 quadrillion per year in 2030. Use synonyms
On the other hand
, the annual consumption of natural gas plateaued at 25 quadrillions from 2015 with projection until 2030 which experienced 5 quadrillions growth from 1980 to 2030. What should be particularly mentioned was the requirement of hydropower was under 5 quadrillions during the mentioned 50 years which was expected to be ten times lower than that of Linking Words
petrol
and Use synonyms
oil
in 2030.
Use synonyms
To sum up
, it can be apparently seen that the importance of Linking Words
petrol
and Use synonyms
oil
considerably outweighed the rest five kinds of energy.Use synonyms