The graphs show changes in spending habits of people in UK between 1971 and 2001. Write a report to a university lecturer describing the data.

The graphs show changes in spending habits of people in UK between 1971 and 2001. Write a report to a university lecturer describing the data.
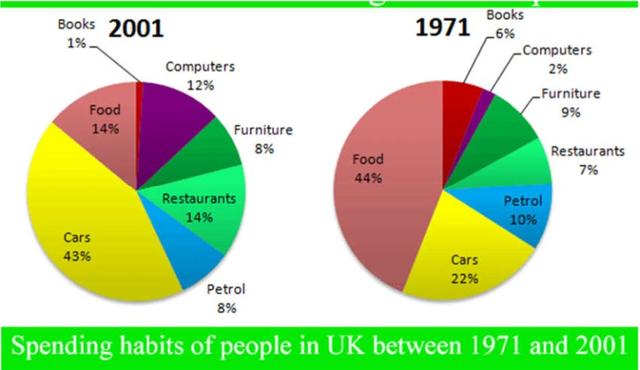
The pie charts show changes in UK spending patterns between 1971 and 30 years later, 2001. As an
overall
trend, increased amounts of money spent on cars, computers and eating out were made up for by drops in expenditure on food and books. In detail, food and
car
Fix the agreement mistake
cars
show examples
made up the two biggest
item
Change to a plural noun
items
show examples
of expenditure in both years. Together they comprised over half of household spending in the UK. Food accounted for 44% of spending in 1971, but
this
dropped by
two thirds
Add a hyphen
two-thirds
show examples
to 14% in 2001.
However
, the outlay on cars doubled, rising from 22% in 1971 to 43% in 2001. Other areas changed significantly. Spending on eating out doubled, climbing from 7% to 14%. The proportion of salary spent on computers increased dramatically, up from 2% in 1971 to 12% in 2001.
However
, as computer expenditure rose, the percentage of outlay on books plunged from 6% to 1%.
Submitted by sajee_5 on

Unauthorized use and/or duplication of this material without express and written permission from this site’s author and/or owner is strictly prohibited. Excerpts and links may be used, provided that full and clear credit is given to Writing9 with appropriate and specific direction to the original content.

Linking words: Don't use the same linking words: "however".
Basic structure: Change the third paragraph.
Vocabulary: Rephrase the word "show" in your introduction.
Vocabulary: Rephrase the word "changes" in your introduction.
Vocabulary: The word "changes" was used 2 times.
Vocabulary: The word "increased" was used 2 times.
Vocabulary: Use several vocabularies to present the data in the third paragraph.
What to do next:
Look at other essays: