
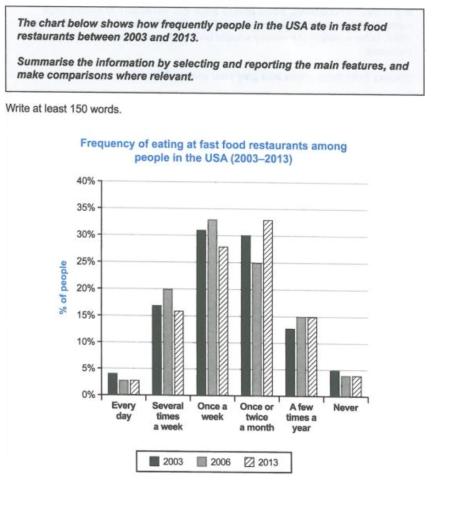
The bar graph illustrates the frequency of eating at fast-food restaurants among individuals in the USA over a 10-year period.
Overall
, it can be seen that people took ready meal every day and never were lowest, Linking Words
whereas
one time a week and once or twice a month was the highest amount.
Looking at the data sets in more detail it can be realised that in 2003 humans consumed 30% monthly. Linking Words
Then
, in 2006 it decreased by about 25%. By 2006, it had increased approximately 33%, which was the largest value in the chart. Linking Words
Moreover
, a few times a year it was 13% in 2003. Linking Words
Then
, in 2006 and 2013 it slightly grew to 15%.
Linking Words
On the other hand
, turning to the remaining statistics it observed that men interested several times in seven days stages was 17% in 2003 and 20% in 2006. In 2013 it fell to 16%. Linking Words
In addition
, once in 7 days it stood at 31% in 2003 and reduced by almost 27% in 2013. Linking Words
Additionally
, in 2003 daily received was 4% and it mitigated at 3% in 2006 Linking Words
then
remained similar until 2013, which was the smallest value in Linking Words
this
figure. Linking Words
Finally
, mankind who did not possess snacks in a given period was on a routine basis.Linking Words