
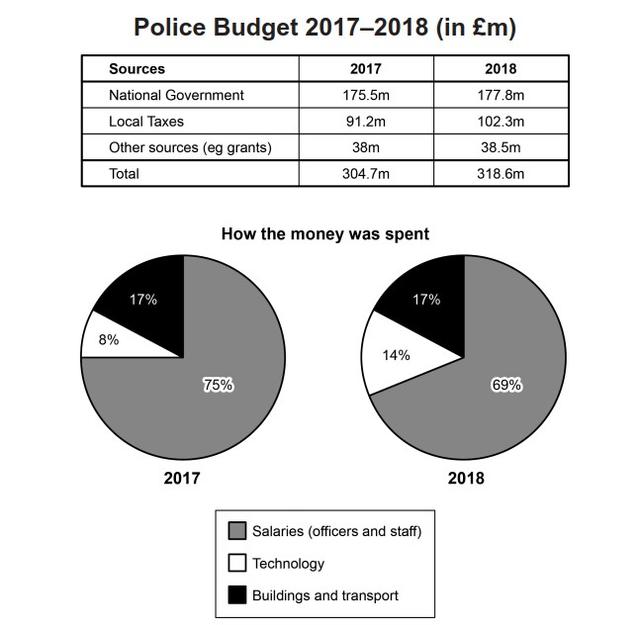
The table and the pie chart compare the financial resources,
such
as Government, taxes, and other fundings and their allocations, including salaries, technology, and buildings and transport, respectively, of the police department between 2017 and 2018. Linking Words
Overall
, it is noticeable that the budgeting of the office was upward Linking Words
at the end
of the period. Linking Words
In addition
, most of the money was addressed to salaries; Linking Words
in contrast
, a small minority was intended for technology requirements.
Linking Words
To begin
with, in 2018, the total of sources increased gradually by 12.6m, which was one-twentieth higher than the previous year. Linking Words
According to
the data, there was a significant climb in local tax contributions from 91.2m to 102.3m, Linking Words
whereas
it coincided with national and other grants that grew slightly by approximately 1.5%.
Linking Words
Furthermore
, in the case of spending money for the Linking Words
last
two years, the staff honorariums shared the greatest percentage, which accounted for 69% and 75%, respectively. Linking Words
Nonetheless
, the number of facility developments levelled off to the same point, reaching just under 20%, Linking Words
while
, at the same time, technology budgeting went into a moderate decline of almost half between 2017 and 2018.Linking Words