
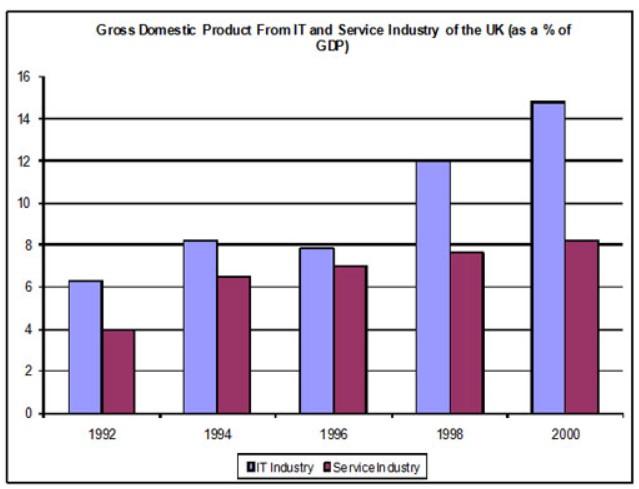
The bar chart compares the percentage of Gross Domestic Product made by the IT
field
and the Use synonyms
Service
industry of the UK during the 1992-2000 years period.
Use synonyms
Overall
, there was a gradual soar in the IT Linking Words
field
GDP except for a slight drop, Use synonyms
furthermore
, the Linking Words
Service
industry had a steady increase too.
Use synonyms
However
, these two snippets of the GDP of the UK differ in growth they had. The IT sphere had risen a little over twice as much as it used to be in 1992, Linking Words
whereas
the Linking Words
Service
indicator had risen twice the time exactly. In 2000 the IT Use synonyms
field
had slightly over fourteen percent in comparison with the Use synonyms
Service
sphere where the percentage was less by six percent. Use synonyms
Also
, the IT indicators had a year where the numbers plummeted, in 1996, to be specific. Meanwhile, the Linking Words
Service
Use synonyms
field
had growth without any wild fluctuations throughout the period.
It is worth mentioning, that in 1996 two indicators had the smallest gap between them.Use synonyms