
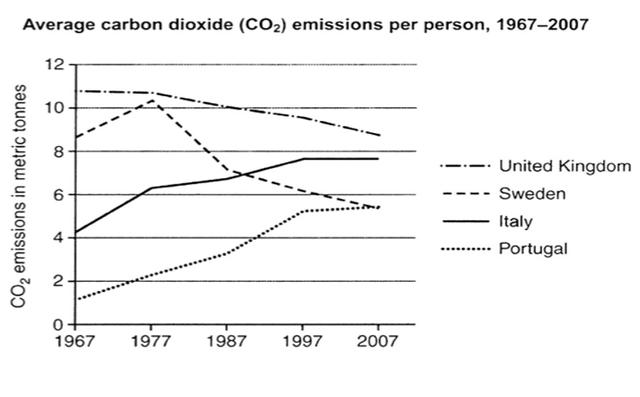
The line graph shows how much carbon dioxide (CO2) was produced and its average amount per person in four countries, namely, the United Kingdom,
Sweden
, Italy and Portugal from 1967 to 2007.
Use synonyms
Overall
, the figure for carbon dioxide emissions for Italy and Portugal increased during the whole Linking Words
period
, despite being the lowest point at the beginning of the Use synonyms
period
, 1-4 Use synonyms
tons
Use synonyms
while
the Linking Words
UK
and Use synonyms
Sweden
showed a decrease until 2007. Use synonyms
In addition
to that, the Linking Words
UK
owned the highest point among others in the whole Use synonyms
period
.
Measuring the highest and the lowest rate of CO2 emissions per person at the beginning of the Use synonyms
period
, in 1967, there were about 11 Use synonyms
tons
of CO2 in the Use synonyms
UK
Use synonyms
whereas
Portugal witnessed only over 1 ton. The share of the Linking Words
UK
declined by about 3 Use synonyms
tons
until the end of the Use synonyms
period
, Use synonyms
by contrast
, people in Portugal emitted much more CO2 increasing to its highest Linking Words
levelof
6tons in 2007.
Looking at the details for Correct your spelling
level of
Sweden
and Italy, the former showed 8 Use synonyms
tons
Use synonyms
as
twice as much as Italy, 4 Change preposition
apply
tons
. Use synonyms
However
, the share of Linking Words
Sweden
went down to over 5 Use synonyms
tons
in 2007, reaching its highest point to over 10 Use synonyms
tons
in the first decade, in 1977. Contrasting to Italy, its figure increased to under 8 Use synonyms
tons
during the Use synonyms
period
between 1967 and 2007.Use synonyms